
Figure 3.
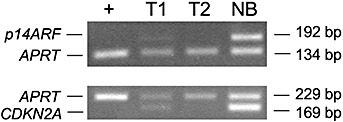
Duplex PCR analysis for homozygous deletion of CDKN2A and p14ARF. The lanes correspond to +, U118MG (control with homozygous deletion of CDKN2A and p14ARF); T1, tumor of patient 1; T2, tumor of patient 2; NB, non‐neoplastic brain tissue. Note homozygous deletion of both CDKN2A and p14ARF in the tumor of patient 2 and homozygous deletion of p14ARF in the tumor of patient 1. bp = length of the respective PCR products in base pairs.