
Figure 5.
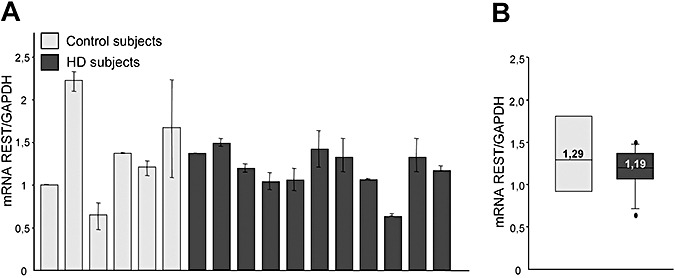
Levels of repressor element‐1 silencing transcription factor/neuron‐restrictive silencer factor (REST/NRSF) mRNA in lymphocytes from subjects with Huntington disease (HD) and control subjects. Total levels of REST/NRSF mRNA were analyzed by means of quantitative polymerase chain reaction (PCR) and normalized to the level of glyceraldehyde 3‐phosphate dehydrogenase (GAPDH) mRNA. A. REST/NRSF mRNA levels were similar in the controls and HD subjects. B. Median REST/NRSF mRNA levels. The boundary of the box closest to zero indicates the 25th percentile, the line within the box marks the median and the boundary of the box farthest from zero indicates the 75th percentile. When 10 or more samples were analyzed, whiskers above and below the box indicate the 90th and 10th percentiles. Outliers are indicated as black circles. The values are the averages ± standard deviation of three independent PCR experiments.