
Figure 1.
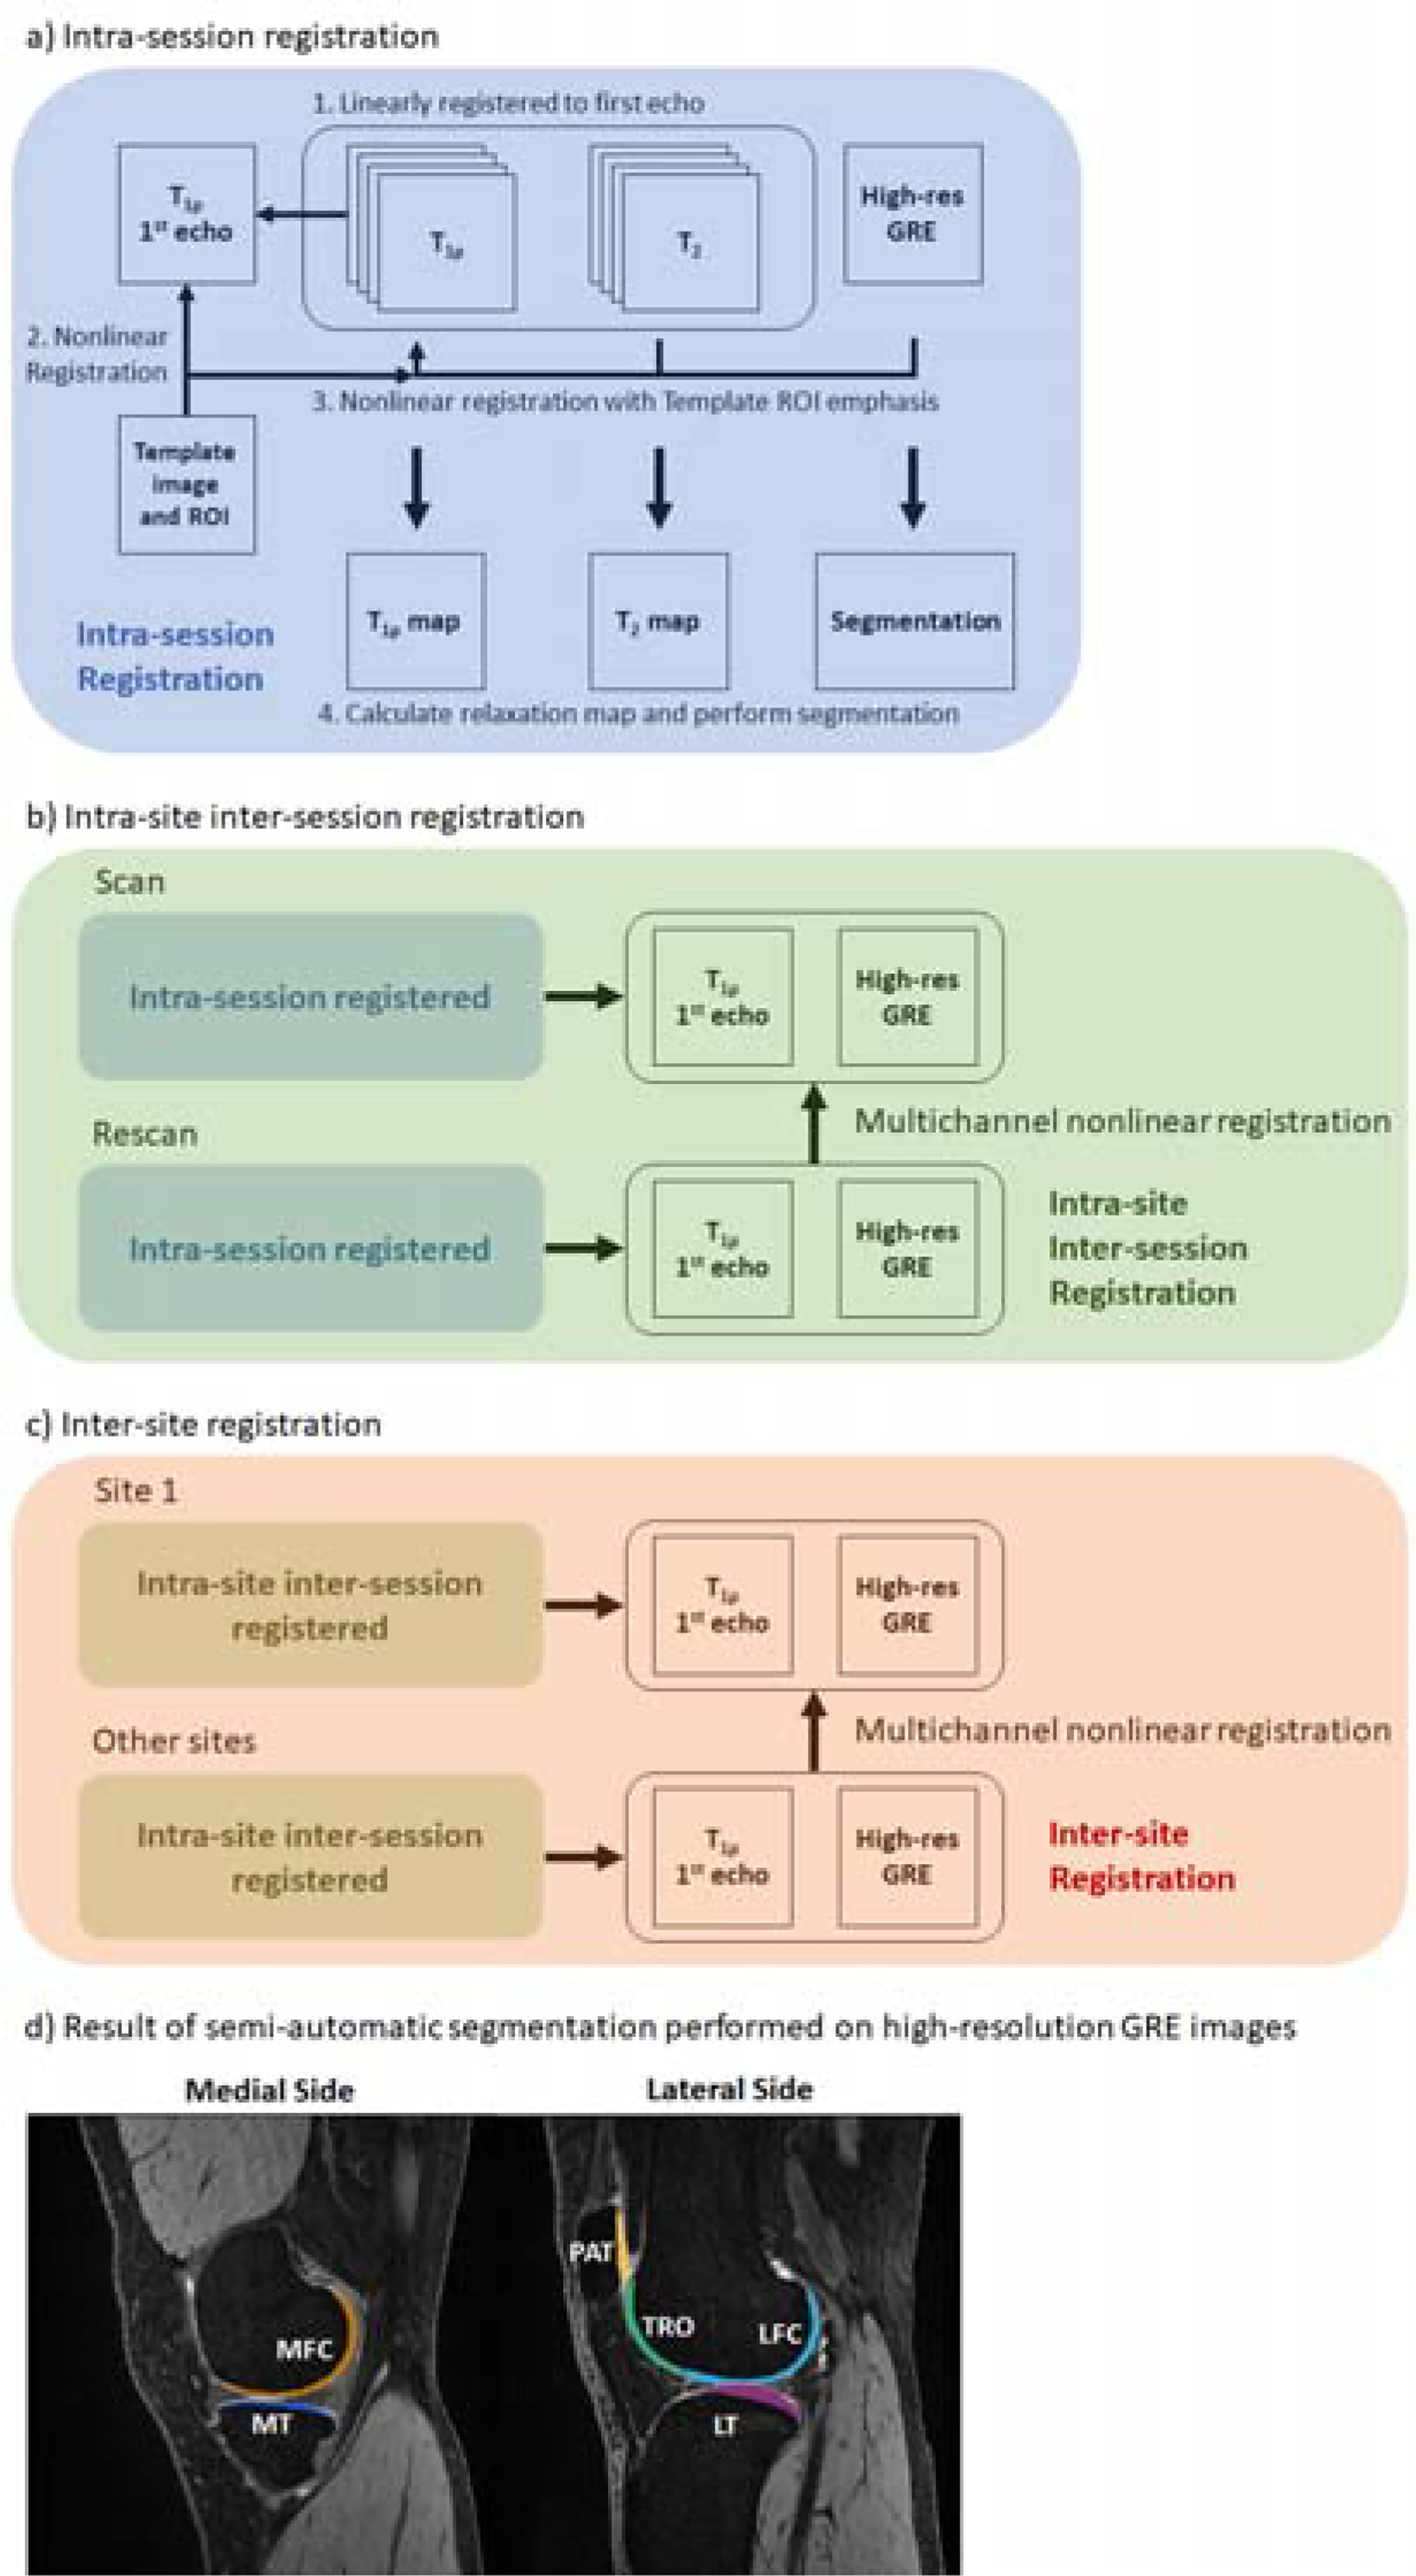
a, b, c) Flowchart of image registrations performed on volunteer data. For intra-site evaluation, segmentation was performed on the high-resolution GRE image of the first scan. For inter-site evaluation, segmentation was performed only on the first scan high-resolution GRE from Site 1. d) Example segmentation map on registered high-resolution GRE image.