
Figure 5.
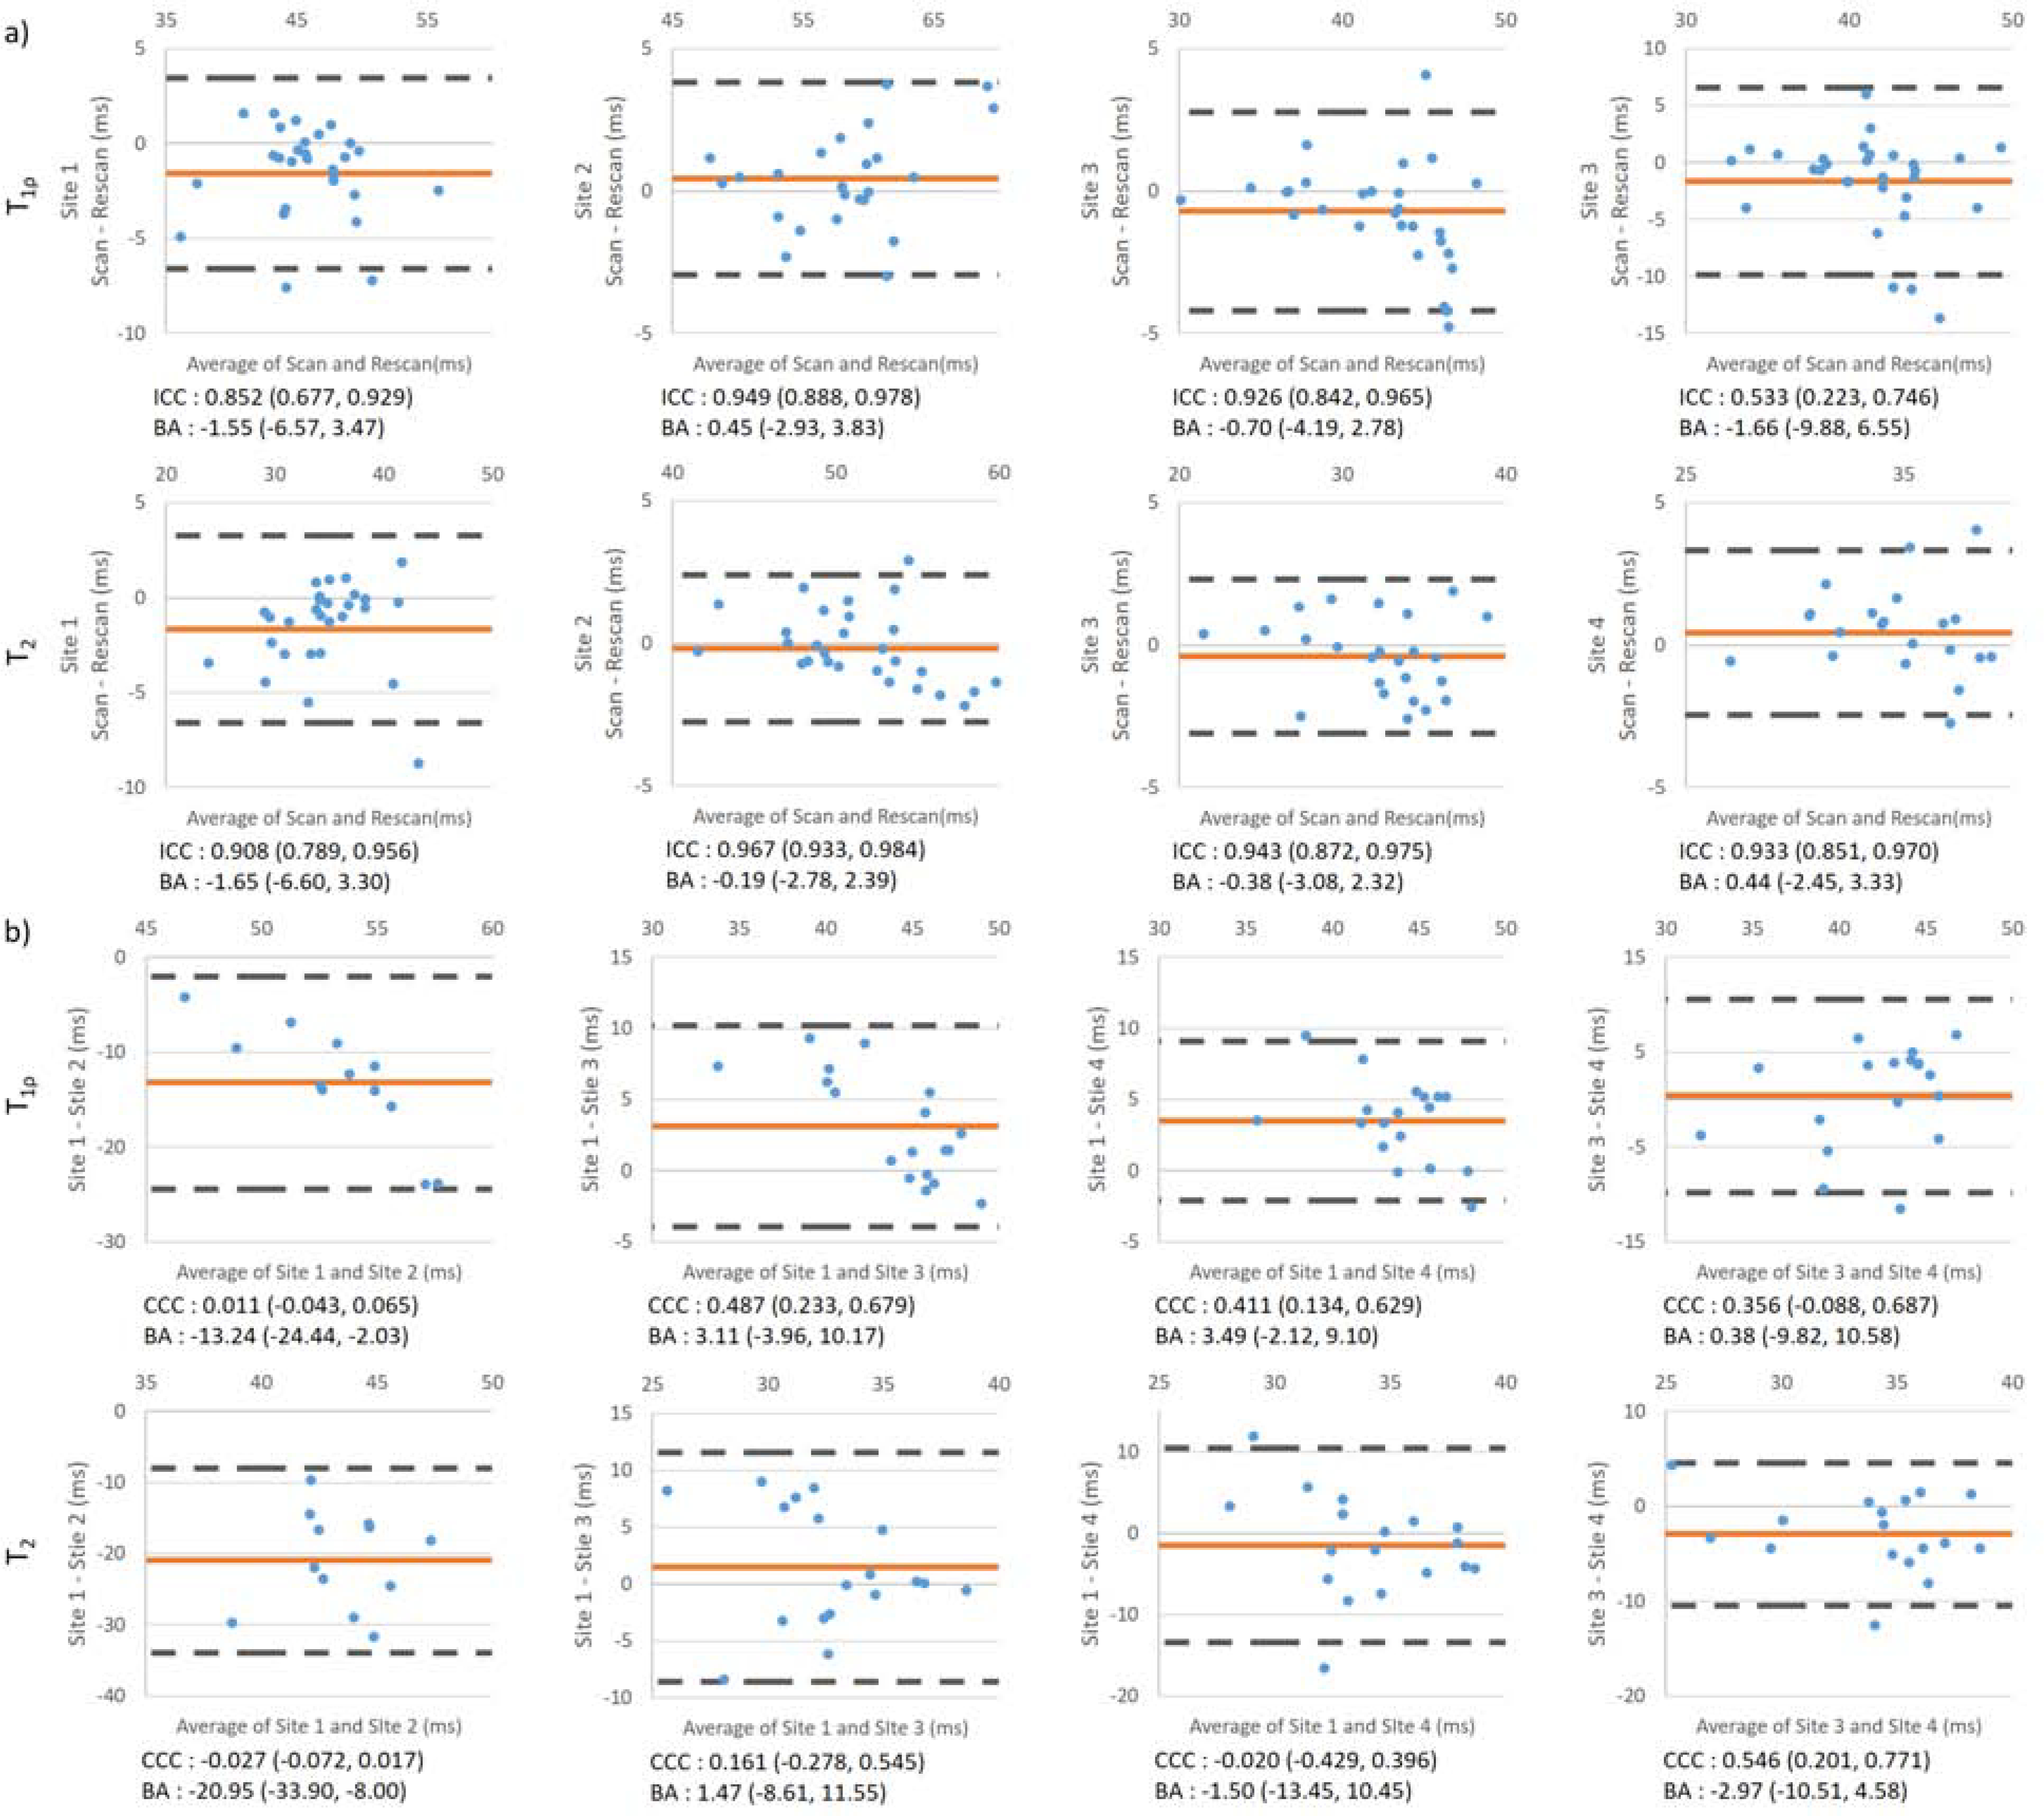
Bland-Altman analysis for (a) intra-site and (b) inter-site T1ρ and T2. Red line indicates the average of the difference value; dashed black line indicates the upper and lower limit of agreement (LOA). ICCs for intra-site repeatability and CCCs for inter-site reproducibility are listed below each plot. Values in the brackets are 95% confidence intervals. Mean difference and 95% limit of agreement were also listed.