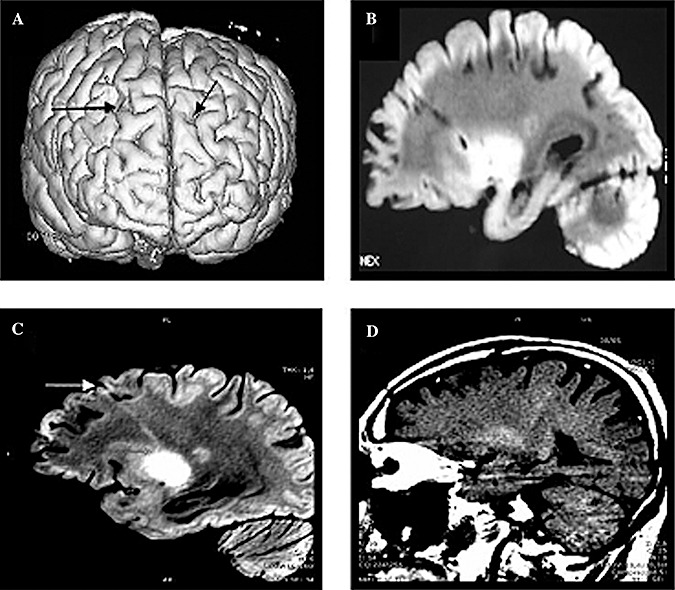
Figure 1.

Brain MR images of the patients. Post‐mortem MRI study. A. Cortical surface rendering from the three‐dimensional MRI of Patient 1; the entry holes of the transplantation are visible (arrows). B. T1‐MT‐weighted image of the transplantation track, Patient 1. C. T2‐weighted image of one transplantation track, Patient 2, T2. D. In vivo MR of Patient 1: corticospinal tract hyperintensity on T1‐MT‐weighted image.
