
Figure 1.
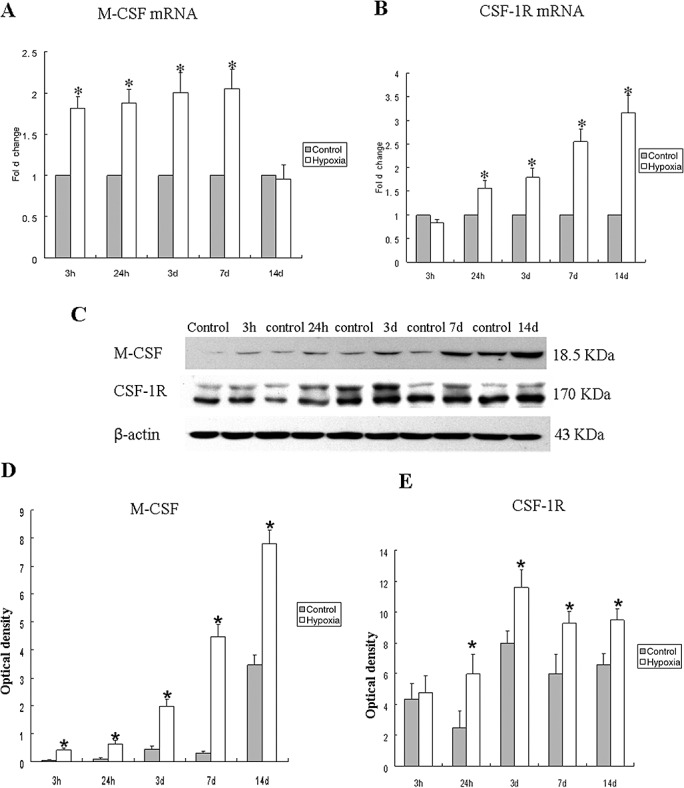
M‐CSF, CSF‐1R mRNA and protein expression in the PWM at 3, 24 h, 3, 7 and 14 days after hypoxic exposure and corresponding control rats. Panels A and B show the graphical representation of the fold changes in M‐CSF and CSF‐1R mRNA, respectively, as quantified by normalization to the β‐actin as an internal control. Panel C shows M‐CSF (18.5 kDa), CSF‐1R (170 kDa) and β‐actin (42 kDa) immunoreactive bands, respectively. Panels D–E show bar graphs depicting significant changes in the optical density of M‐CSF and CSF‐1R, respectively, following hypoxic exposure when compared with their corresponding controls. Significant difference in mRNA and protein levels in the PWM after the hypoxic exposure is evident when compared with controls. *P < 0.05. Abbreviations: M‐CSF = macrophage colony‐stimulating factor; PWM = periventricular white matter.