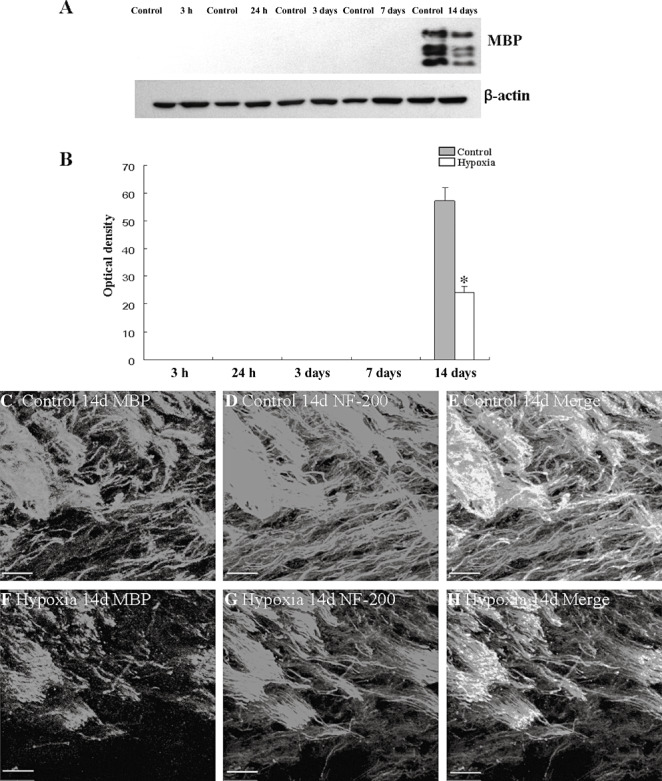
Figure 6.

MBP and NF‐200 protein expression in the PWM at 14 days after the hypoxic exposure and the corresponding control rats. A shows MBP and β‐actin (42 KDa) immunoreactive bands, respectively. Bar graph in B shows significant decrease in the optical density of MBP following hypoxic exposure when compared with the corresponding controls (*P < 0.01). Confocal images showing the expression of MBP (C, green), NF‐200 (D, red), and co‐localized expression of MBP and NF‐200 (E) in the PWM at 14 days of control rats. F–H show the expression of MBP (F, green), NF‐200 (G, red), and co‐localized expression of MBP and NF‐200 (H) at 14 days after the hypoxic exposure. Note the MBP positive processes and NF‐200 positive axons are disrupted following the hypoxic exposure (F,G) as compared with the control (C,D). Scale bars: C–H, 50 µm. Abbreviation: PWM = periventricular white matter.
