Figure 7.

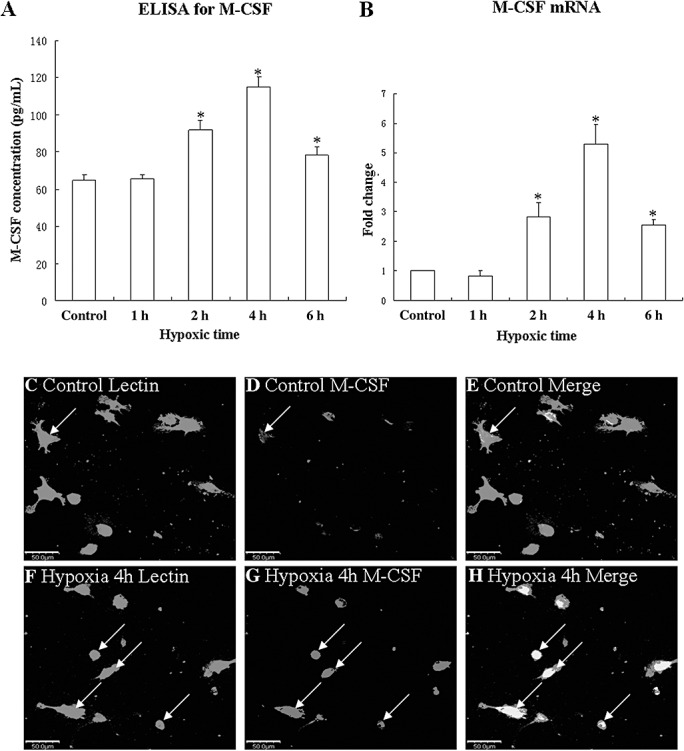
M‐CSF mRNA and protein expression in cultured microglia in the controls and at 1, 2, 4 and 6 h after hypoxic exposure. Bar graph in panel A shows that release of M‐CSF is significantly increased in the medium at 2, 4, and 6 h after hypoxic exposure. Bar graphs in panel B show changes in M‐CSF mRNA expression. Significant differences in mRNA and protein levels in hypoxic microglial cells are evident when compared with controls (*P < 0.05). Confocal images of cultured control microglia showing the expression of lectin (C, green), M‐CSF (D, red) and co‐localized expression of lectin and M‐CSF (E). F‐H show the expression of lectin (F, green), M‐CSF (G, red) and co‐localized expression of lectin and M‐CSF (H) after treatment with 3% oxygen for 4 h. Note the elevated expression of M‐CSF at 4 h after hypoxic exposure (G) as compared with the control cells (D). *P < 0.01. Scale bars: C–H, 50 µm. Abbreviation: M‐CSF = macrophage colony‐stimulating factor.
