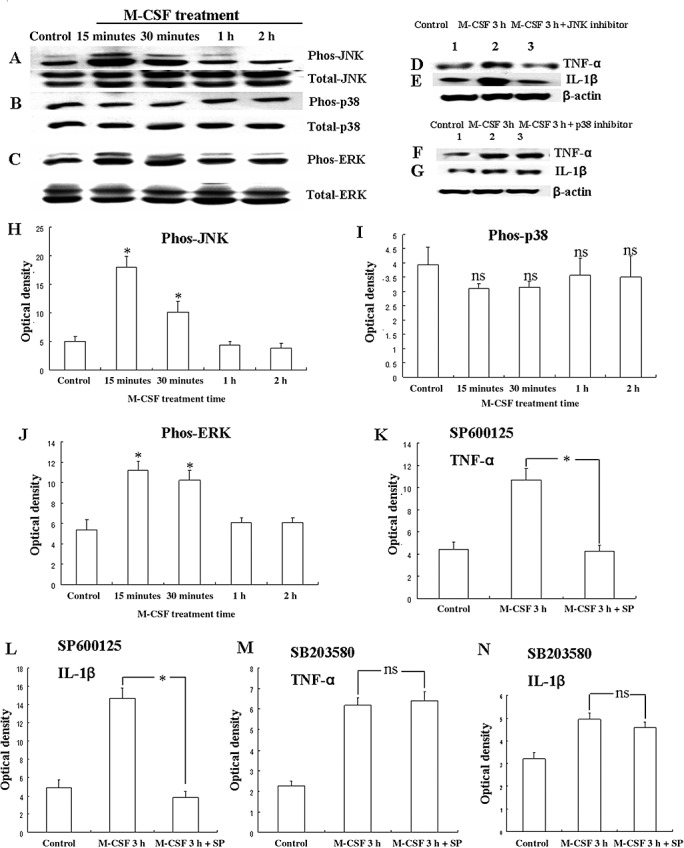
Figure 9.

Western blot analysis showing M‐CSF induced TNF‐α and IL‐1β production via activation of MAPK pathway in astrocytes. Panels A, B and C show JNK, p38, ERK phosphorylation and total JNK, p38, ERK immunoreactive bands. Panels D and E show immunoreactive bands which indicate that SP600125 (a JNK inhibitor) suppress the expression of TNF‐α and IL‐1β, respectively, in the astrocytes after M‐CSF treatment for 3 h. Panels F and G show immunoreactive bands, which indicate that SB203580 (a p38 inhibitor) cannot suppress the expression of TNF‐α and IL‐1β, respectively, in the astrocytes after M‐CSF treatment for 3 h. Panels H and J are bar graphs showing significant changes in the optical density of JNK and ERK phosphorylation, respectively, following treatment with M‐CSF. Panels I is a bar graph showing no significant changes in the optical density of p38 phosphorylation following treatment with M‐CSF. Panels K–L are bar graphs showing significant suppression in expression of TNF‐α and IL‐1β by SP600125, respectively. Panels M–N are bar graphs showing no significant suppression in expression of TNF‐α and IL‐1β by SB203580, respectively. *P < 0.05, ns: P > 0.05. Abbreviation: M‐CSF = macrophage colony‐stimulating factor.
