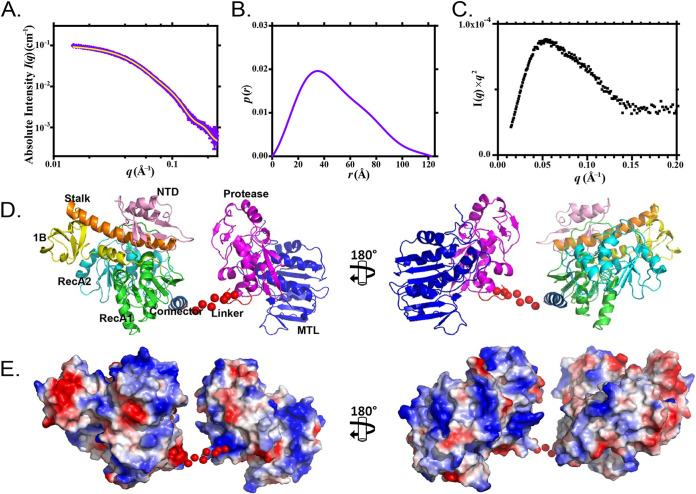
FIG 1.
SAXS analysis of nsP2. (A) Scattering experimental data and (B) distance distribution function p(r) of nsP2 are shown in purple. The structural fitting of the CORAL model for nsP2 is shown in yellow. (C) Normalized Kratky plot of nsP2. (D) Solution architecture of nsP2 modeled by CORAL. (E) Electrostatic surface potential of nsP2 before (left) and after (right) 180° rotation. The CORAL model is displayed as ribbon diagrams. The random dummy residues are shown as red dots and were used to represent seven missing linker residues. The N-terminal domain (NTD) is in pink, the stalk domain is in orange, domain 1B is in yellow, the RecA1 domain is in green, the RecA2 domain is in cyan, the connector is in sky blue, the protease is in magenta, and the MTL domain is in blue.

