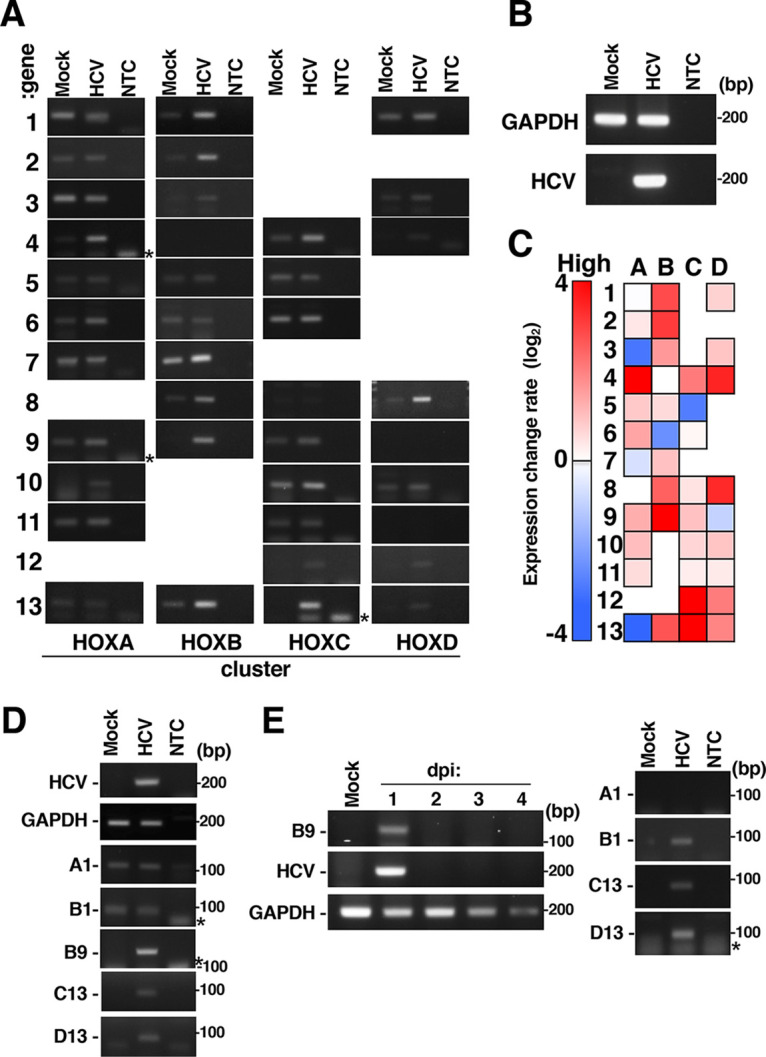
FIG 1.

Effect of HCV infection on HOX gene expression. Huh7OK1 cells were infected with HCVcc at a multiplicity of infection (MOI) of 0.1 and were then harvested at 9 dpi. Total RNA was prepared from HCV-infected cells (HCV) or mock-infected cells (Mock). HCV RNA and HOX gene mRNA and GAPDH mRNA levels were evaluated by RT-sqPCR. (A) Expression of HOX genes. The gene numbers and the cluster names are indicated on the left and bottom, respectively, of the panels. NTC, no-template control. (B) Expression of GAPDH mRNA and HCV RNA. (C) Heatmap analysis of HOX gene expression in HCV-infected cells. The intensity of each band in panels A and B was quantified using ImageJ software. The data are presented as the ratio of each HOX gene mRNA level to the GAPDH mRNA level. The red and blue colors indicate higher and the lowest expression levels of each HOX gene, respectively. The data shown in this figure are representative of three independent experiments. (D) Huh7.5.1 cells were infected with HCVcc at an MOI of 0.1 and were then harvested at 9 dpi. HOX gene mRNA and GAPDH mRNA levels were evaluated by RT-sqPCR. A1, B1, B9, C13, and D13 indicate HOXA1, HOXB1, HOXB9, HOXC13, and HOXD13. (E) Primary human hepatocytes (PHHs) were infected with HCVcc at an MOI of 1 and were harvested at an indicated dpi (left half) or 1 dpi (right half). HOX gene mRNA and GAPDH mRNA levels were evaluated by RT-sqPCR. The asterisk indicates a product of primer dimer on the left side of the panel. A1, B1, B9, C13, and D13 indicate HOXA1, HOXB1, HOXB9, HOXC13, and HOXD13.
