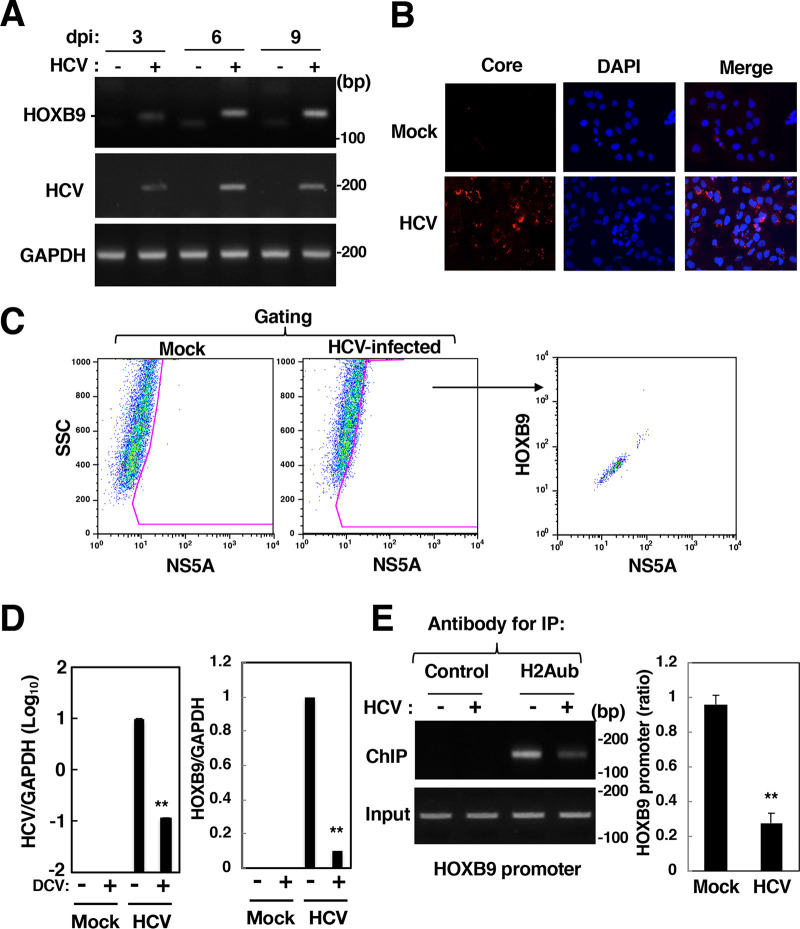
FIG 3.
Effect of HCV infection on HOXB9 expression and H2A K119 monoubiquitination in the HOXB9 gene promoter. (A) HCV-infected cells were harvested at 3, 6, or 9 dpi. HOXB9 and GAPDH mRNAs were evaluated by RT-sqPCR in HCV-infected cells (+) and mock-infected cells (–). (B) HCV-infected (HCV) and mock-infected (Mock) cells were fixed at 9 dpi and were then stained with DAPI. The cells were stained with the mouse anti-core antibody and AF594-conjugated goat anti-mouse IgG antibodies. The stained samples were observed under a BZ-9000 fluorescence microscope. (C) HCV-infected and mock-infected cells were fixed, permeabilized, and stained with the mouse anti-NS5A IgG and rabbit anti-HOXB9 IgG and then with AF488-conjugated goat anti-mouse IgG antibody and AF647-conjugated goat anti-rabbit IgG antibody. The stained cells were subjected to flow cytometry. The data were analyzed with FlowJo software. Sorted cells were gated as NS5A-positive cells and then plotted based on fluorescence intensities of HOXB9 and NS5A. (D) HCV-infected and mock-infected cells were treated with 20 nM daclatasvir (DCV: +) or DMSO (–) from 9 to 15 dpi. The intracellular HCV RNA level and the HOXB9 and GAPDH mRNA levels were estimated by RT-qPCR. (E) The level of H2Aub in the HOXB9 gene promoter was evaluated by a ChIP assay using the antibody specific for H2Aub (H2Aub) or a nonspecific antibody (Control). Immunoprecipitates were analyzed by sqPCR (left panels) and qPCR (right graph) using the HOXB9 promoter-specific primer pair. The values of immunoprecipitates were normalized to that of input DNA and are presented as relative values with respect to mock-infected cells. The data shown in this figure are representative of three independent experiments and are presented as the mean ± SD values (n = 3). **, P < 0.01.

