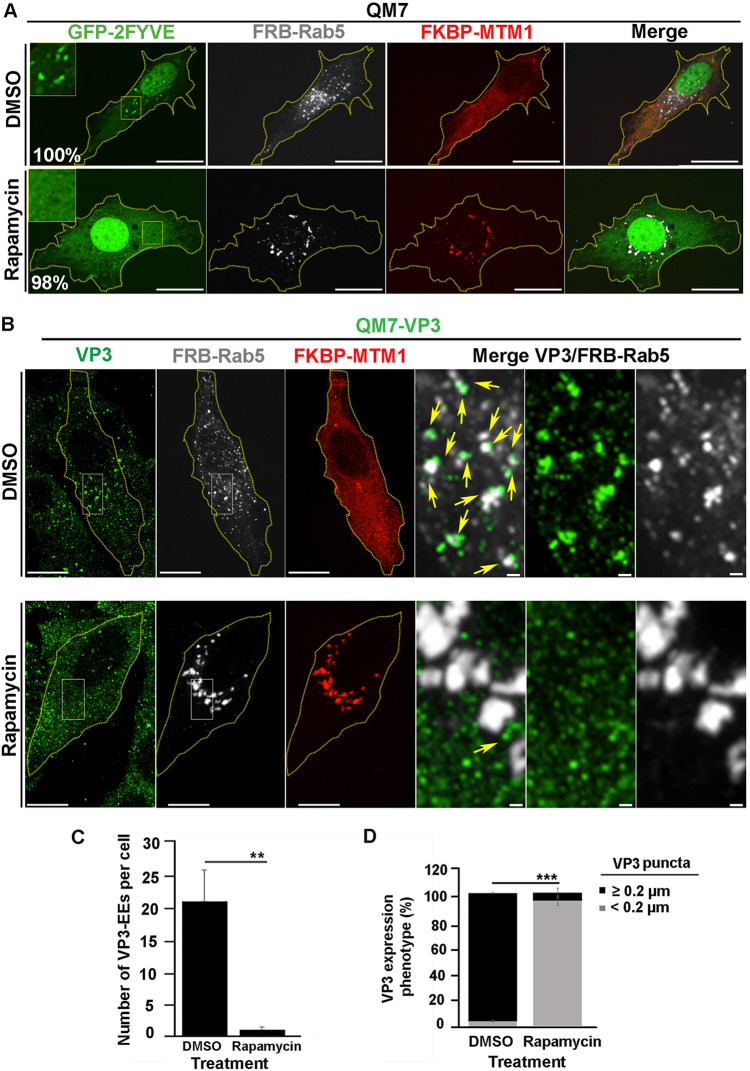
FIG 5.
The localized depletion in endosomal PtdIns(3)P prevents VP3 localization on EEs. (A) Analysis of GFP-2FYVE subcellular distribution in QM7 cells after rapamycin-induced localized depletion of PtdIns(3)P in EEs. QM7 cells were transiently cotransfected with mCherry-FKBP-MTM1, iRFP-FRB-Rab5, and GFP-2FYVE for 12 h and subsequently treated for 15 min with DMSO or 1 μM rapamycin to induce the recruitment of FKBP-MTM1 to the FRB-Rab5-decorated membranes to trigger PtdIns(3)P dephosphorylation in EEs. Cells were fixed and visualized by spinning-disc confocal microscopy. Main panels show representative images of merged z-stacks. Framed regions show amplified images that depict the intracellular localization of GFP-2FYVE. The images are representative of three independent experiments. Bars, 10 μm. Percentages were calculated by analyzing 50 cells per condition. (B to D) Analysis of VP3 distribution in cells locally depleted of PtdIns(3)P. QM7-VP3 cells were transiently cotransfected with mCherry-FKBP-MTM1 and iRFP-FRB-Rab5 for 12 h and subsequently treated for 15 min with DMSO or 1 μM rapamycin. The cells were fixed, permeabilized, VP3 (green) stained as described in Materials and Methods, and analyzed by spinning-disc confocal microscopy. (B) Representative images of merged z-stacks. The images are representative of three independent experiments. Bars, 10 μm (left panels) or 0.5 μm (right panels). (C) The number of VP3-Rab5-positive EEs per cell were calculated as described in Materials and Methods. The images are representative of three independent experiments. Data are means and SD. **, P < 0.05. (D) VP3 expression phenotypes were determined employing Volocity software as described in Materials and Methods. Twenty-five cells per condition were scored for each experiment. Data are means and SD. ***, P < 0.01.

