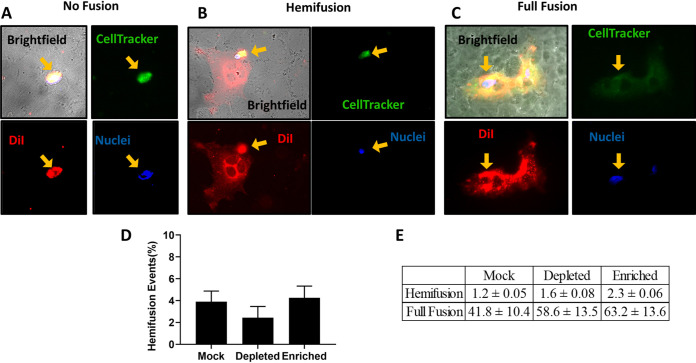
FIG 5.
Heterologous cell-cell fusion upon cholesterol alteration. (A to C) PK13 cells were transfected with either pcDNA3.1(+) or NiV F/G expression plasmids. Vero cells were dyed with CellTracker green (top right), DiI (bottom right), and Hoechst stain (bottom left) (merged filters, along with bright-field images, are in the top left panel) to visualize their cytoplasm, plasma membrane, and nuclei, respectively, before being overlaid onto a monolayer of PK13 cells for 4 h before fixation with 0.5% paraformaldehyde. Examples of no fusion (A), hemifusion (B), and full fusion (C) are shown. (D) Hemifusion events (percent) from a 6-well plate were completely surveyed at a magnification of ×40 to determine relative levels of hemifusion and full-fusion events for each treatment. Data shown represent averaged ratios of hemifusion/full cell-cell fusion with standard errors. (E) Average hemifusion and full-fusion counts per well with standard errors (n = 5).

