FIG 3.
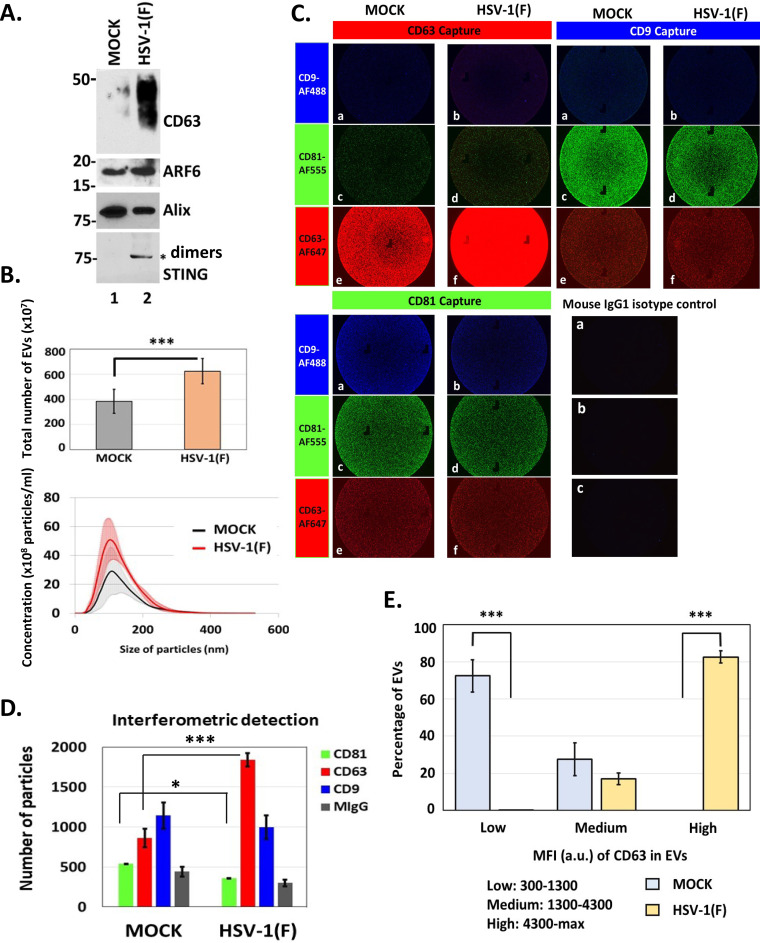
Increased production of EVs upon HSV-1 infection. (A) Total EVs were isolated from the supernatant of infected or uninfected HEL cells as for Fig. 1. The first seven fractions containing the EVs were pooled, washed with PBS, and quantified by NTA. Equal numbers of EVs were analyzed by immunoblot analysis using antibodies against CD63, ARF6, Alix, and STING. The STING dimers are prevalent in EVs released from HSV-1-infected cells. (B) EVs were isolated as for Fig. 1 and quantified using NTA. The quantity of the EVs and their size distribution are depicted. Results represent the averages from three independent EV isolations. The color-shaded regions are error bars that are used to show the variation in the concentration and size of EVs between different EV isolations. (C) Chips coated with separate capture spots for anti-CD63, anti-CD81, anti-CD9, or mouse isotype control IgG1 were placed in the center of separate wells in a 24-well plate. Diluted sample (40 μl) prepared as for Fig. 1 was applied to each chip. Sterile water was added to the void space between wells to form a humidity chamber, and the plate was sealed and allowed to incubate for 16 h at room temperature. Subsequently, wells containing chips were washed three times with buffer supplied by the manufacturer (NanoView Biosciences, USA). Anti-CD9-Alexa Fluor 488, anti-CD81-Alexa Fluor 555, or anti-CD63-Alexa Fluor 647 was applied to the chips for 1 h at room temperature. After washing, the chips were dried and imaged using an ExoView R100 reader on nScan2 2.7.6 software and analyzed using NanoViewer 2.8.9. (D) Interferometric detection of EVs from panel C, which were captured using different anti-tetraspanin antibodies, was performed using NanoViewer 2.8.9 supplied by the manufacturer (NanoView Biosciences). Total captured EVs on each chip were quantified. (E) Mean fluorescence intensity (MFI) of CD63 in single EVs from uninfected (mock) and infected (HSV-1) samples was quantified using NanoViewer 2.8.9 supplied by the manufacturer (NanoView Biosciences). MFI values were divided in 3 arbitrary groups; the percentage of EVs from mock or infected samples in each group is depicted. *, P ≤ 0.05; **, P ≤ 0.01; ***, P ≤ 0.001.

