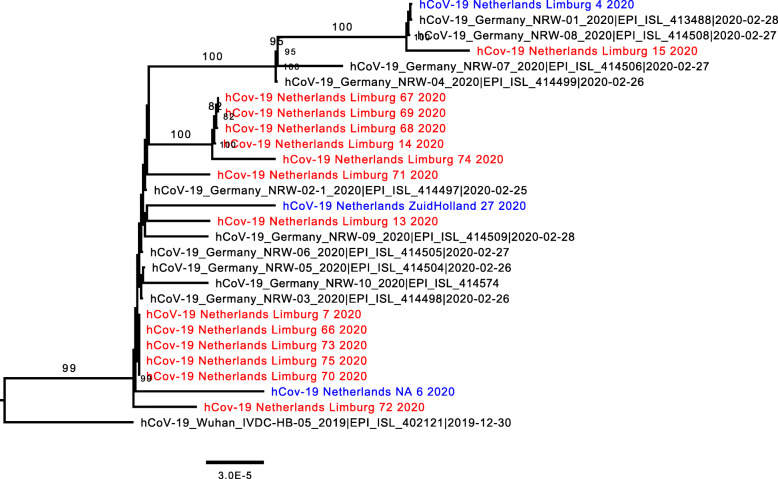
Fig. 2.
Zoom in of the full phylogenetic tree on the Dutch LTCF residents from the LTCF in Sittard, the Netherlands, March 2020 (n = 14). The scale bar represents the number of substitutions per site. Sequences from the Netherlands are depicted in blue, and specific sequences from this study in red. Samples 13, 14, and 15 depicted in red were samples acquired from hospitalized patients in the regional hospital around the same time of the LTCF outbreak. The remaining red samples were acquired from eleven COVID-19 positive LTCF residents

