8.

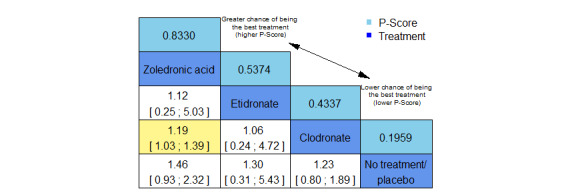
Leagutetable of sensitivity network meta‐analysis including only studies with low risk of bias for outcome proportion of participants with pain response. Treatment options are ranked as indicated by the arrow from top: greater chance of being the best treatment (higher P‐scores) to bottom: lower chance of being the best treatment (lower P‐score). Network estimates with 95% confidence intervals indicating an effect between two of the treatment options are marked in yellow: treatment option in column better than treatment option in row.
No. of studies: 3. No. of treatments: 4. No. of pairwise comparisons: 3. No. of designs: 3
Heterogeneity/inconsistency: Qtotal = 0, P = not available; I2 = not available; Tau2 = not available Treatment effects + 95% confidence intervals (risk ratios, random‐effects model)
