24.

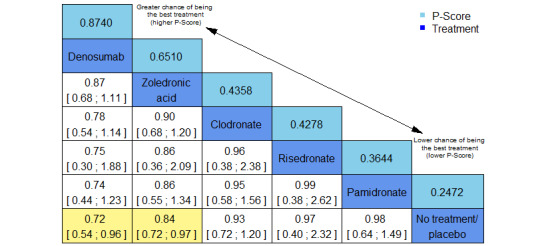
Leaguetable of network meta‐analysis for outcome total number of skeletal‐related events. Treatment options are ranked as indicated by the arrow from top: greater chance of being the best treatment (higher P‐scores) to bottom: lower chance of being the best treatment (lower P‐score). Network estimates with 95% confidence intervals indicating an effect between two of the treatment options are marked in yellow: treatment option in column better than treatment option in row. Global approach to check inconsistency/heterogeneity: Q‐statistics, I2.
No. of studies: 12. No. of treatments: 6. No. of pairwise comparisons: 12. No. of designs: 6
Qtotal = 11.48, P = 0.12/Qwithin = 11.38, P = 0.077/Qbetween = 0.09, P = 0.76; I2 = 39%, Tau2 = 0.0124 Treatment effects + 95% confidence intervals (risk ratios, random‐effects model)
