56.

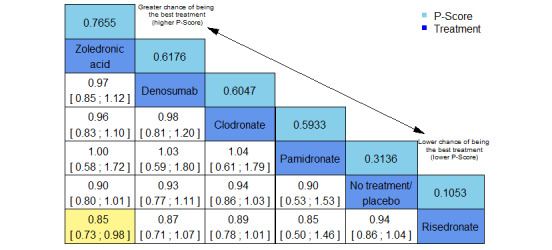
Leaguetable of network meta‐analysis for the outcome mortality. Treatment options are ranked as indicated by the arrow from top: greater chance of being the best treatment (higher P‐scores) to bottom: lower chance of being the best treatment (lower P‐score). Network estimates with 95% confidence intervals indicating an effect between two of the treatment options are marked in yellow: treatment option in column better than treatment option in row. Global approach to check inconsistency/heterogeneity: Q‐statistics, I2.
No. of studies: 13. No. of treatments: 6. No. of pairwise comparisons: 13. No. of designs: 6
Qtotal = 3.35, P = 0.91/Qwithin = 3.15, P = 0.87/Qbetween = 0.20, P = 0.65; I2 = 0.0%, Tau2 = 0
Treatment effects + 95% confidence intervals (risk ratios, random‐effects model)
