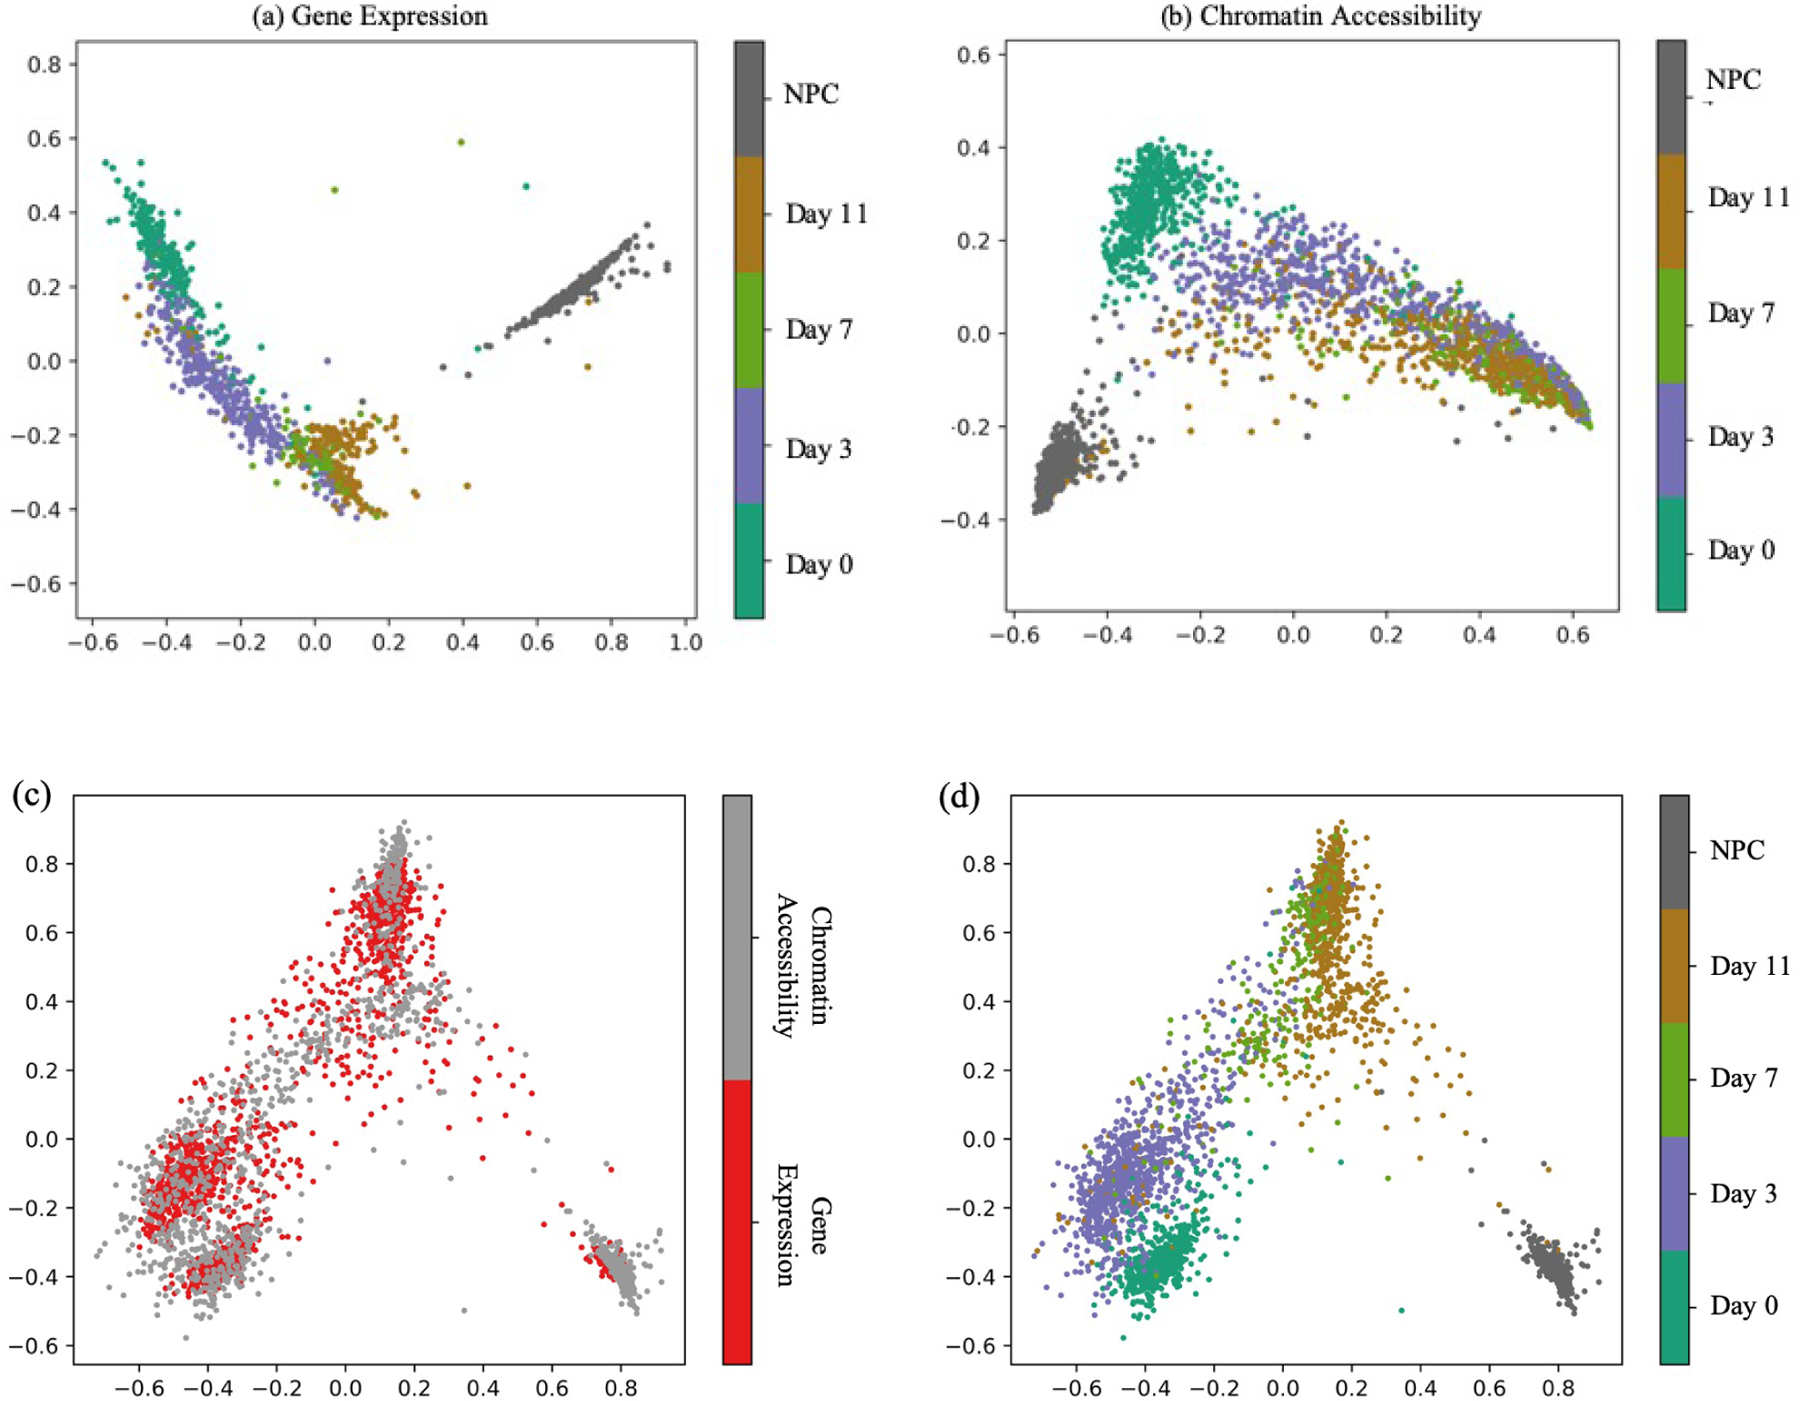
Figure 5:

Mouse embryonic stem cell data. (a) The first two principal components of the mouse scRNA-Seq data. (b) Similar to panel (a), but for the scATAC-seq data. (c) The 4-dimensional embedding learned by MMD-MA, projected to 2D via PCA. Points are colored according to data type. (d) Same as panel (c), but coloring points by time point.
