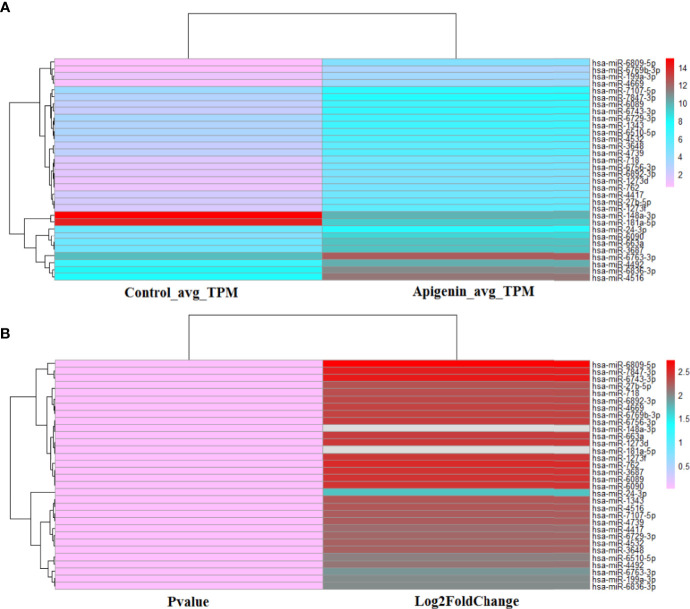
Figure 3.
The heat map of 32 top apigenin-modulated miRNAs in Huh 7 cells. (A) The hierarchical clustering analysis was performed to analyze the average TPM expression of miRNAs in Huh 7 cells treated with 10 µM apigenin vs. 0.1% DMSO. (B) The hierarchical clustering analysis was performed to analyze the P value and Log2Fold of the 32 top apigenin-modulated miRNAs (P value ≤ 0.001). Red indicates high relative expression and pink indicates low relative expression.

