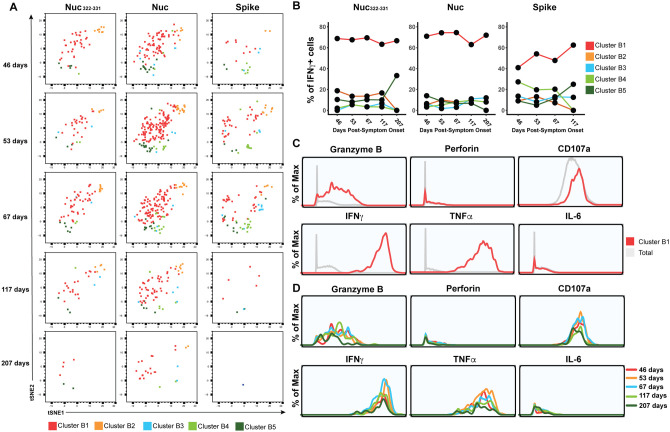
Figure 6. PID4103’s CD8+ T cells responding to Nuc322–331 stimulation are more similar to those responding to nucleocapsid than to spike peptides.
(A) Cluster distribution of CD8+ T cells responding to Nuc322–331, or to peptides spanning the entire nucleocapsid or spike proteins. IFNγ+ CD8+ T cells from the Nuc322–331, nucleocapsid, or spike-stimulated specimens were split into five clusters (B1-B5) by flowSOM. The responding cells are shown as dot plots and colored according to their cluster membership. Note the higher similarity of cells in the tSNE among the Nuc322–331- and Nuc-specific cells, relative to the spike-specific ones.
(B) Cluster B1 is dominant among CD8+ T cells with all three specificities, but more prominent among the Nuc322–331- and Nuc-specific cells.
(C) Cluster B1 cells, to which most cells responding to Nuc322–331, Nuc, and Spike stimulation CD8+ T cells belong, are characterized by high expression levels of the cytolytic markers granzyme B and CD107a, and the cytokines IFNγ and TNFα.
(D) The sub-populations of cluster B1 cells expressing higher levels of effector cytokines and cytolytic molecules decrease over the course of convalescence. Shown are histogram plots depicting cluster B1 cells colored according to timepoint. Although all the cells shown belong to cluster B1, those from the later timepoints expressed lower levels of granzyme B, CD107a, IFNγ, and TNFα.

