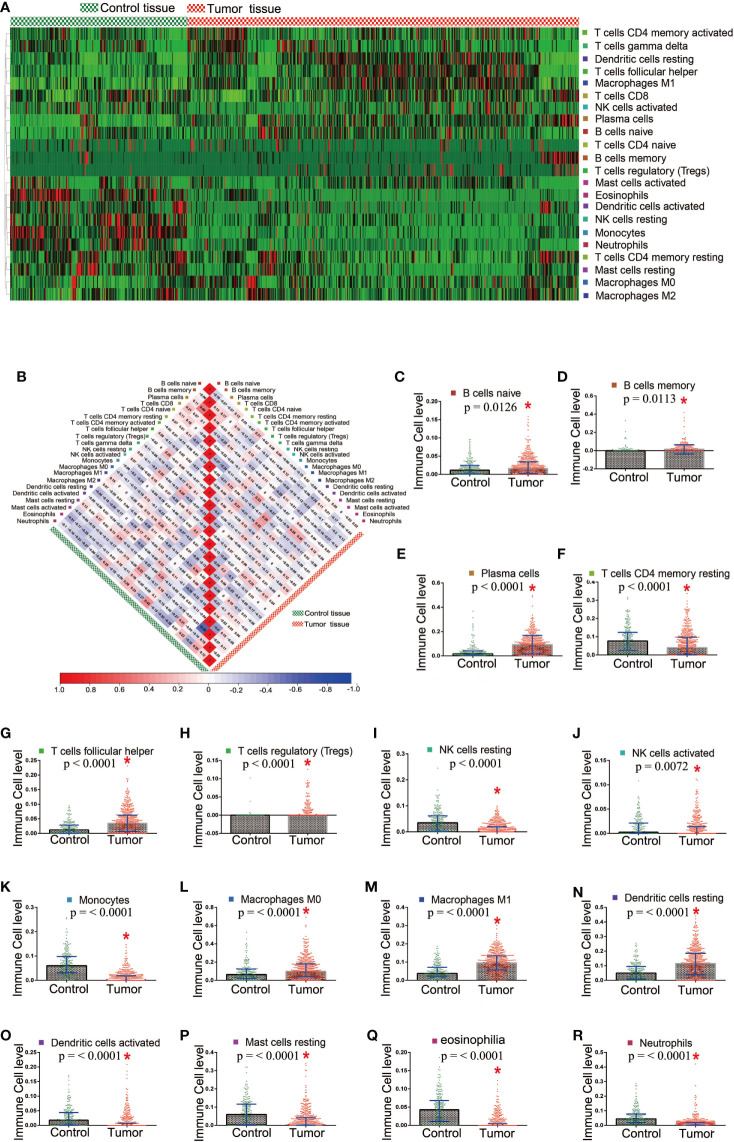
Figure 3.
Different distribution of TICs between the tumor and control tissue samples. (A) Heatmap showed the distribution state in tumor and control tissue samples; (B) The correlation among TICs in the tumor and control tissue samples; (C–R) 16 TICs which showed significant difference in the distribution between the tumor and control tissue samples.

