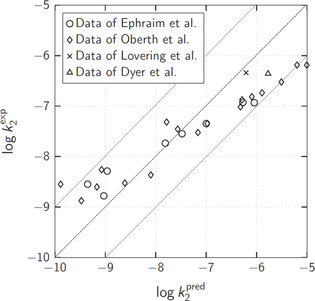
Figure 5.

Log‐log plot of experimental rate constants from literature versus predicted rate constants . The dashed line indicates perfect match, while the dotted lines mark a deviation of factor 10 between experimental and predicted rate constants. The experimental rate constants are taken from the studies of Ephraim et al., [33] Obert and Bruenner, [34] Dyer et al. [24] as well as Lovering and Laidler. [21]
