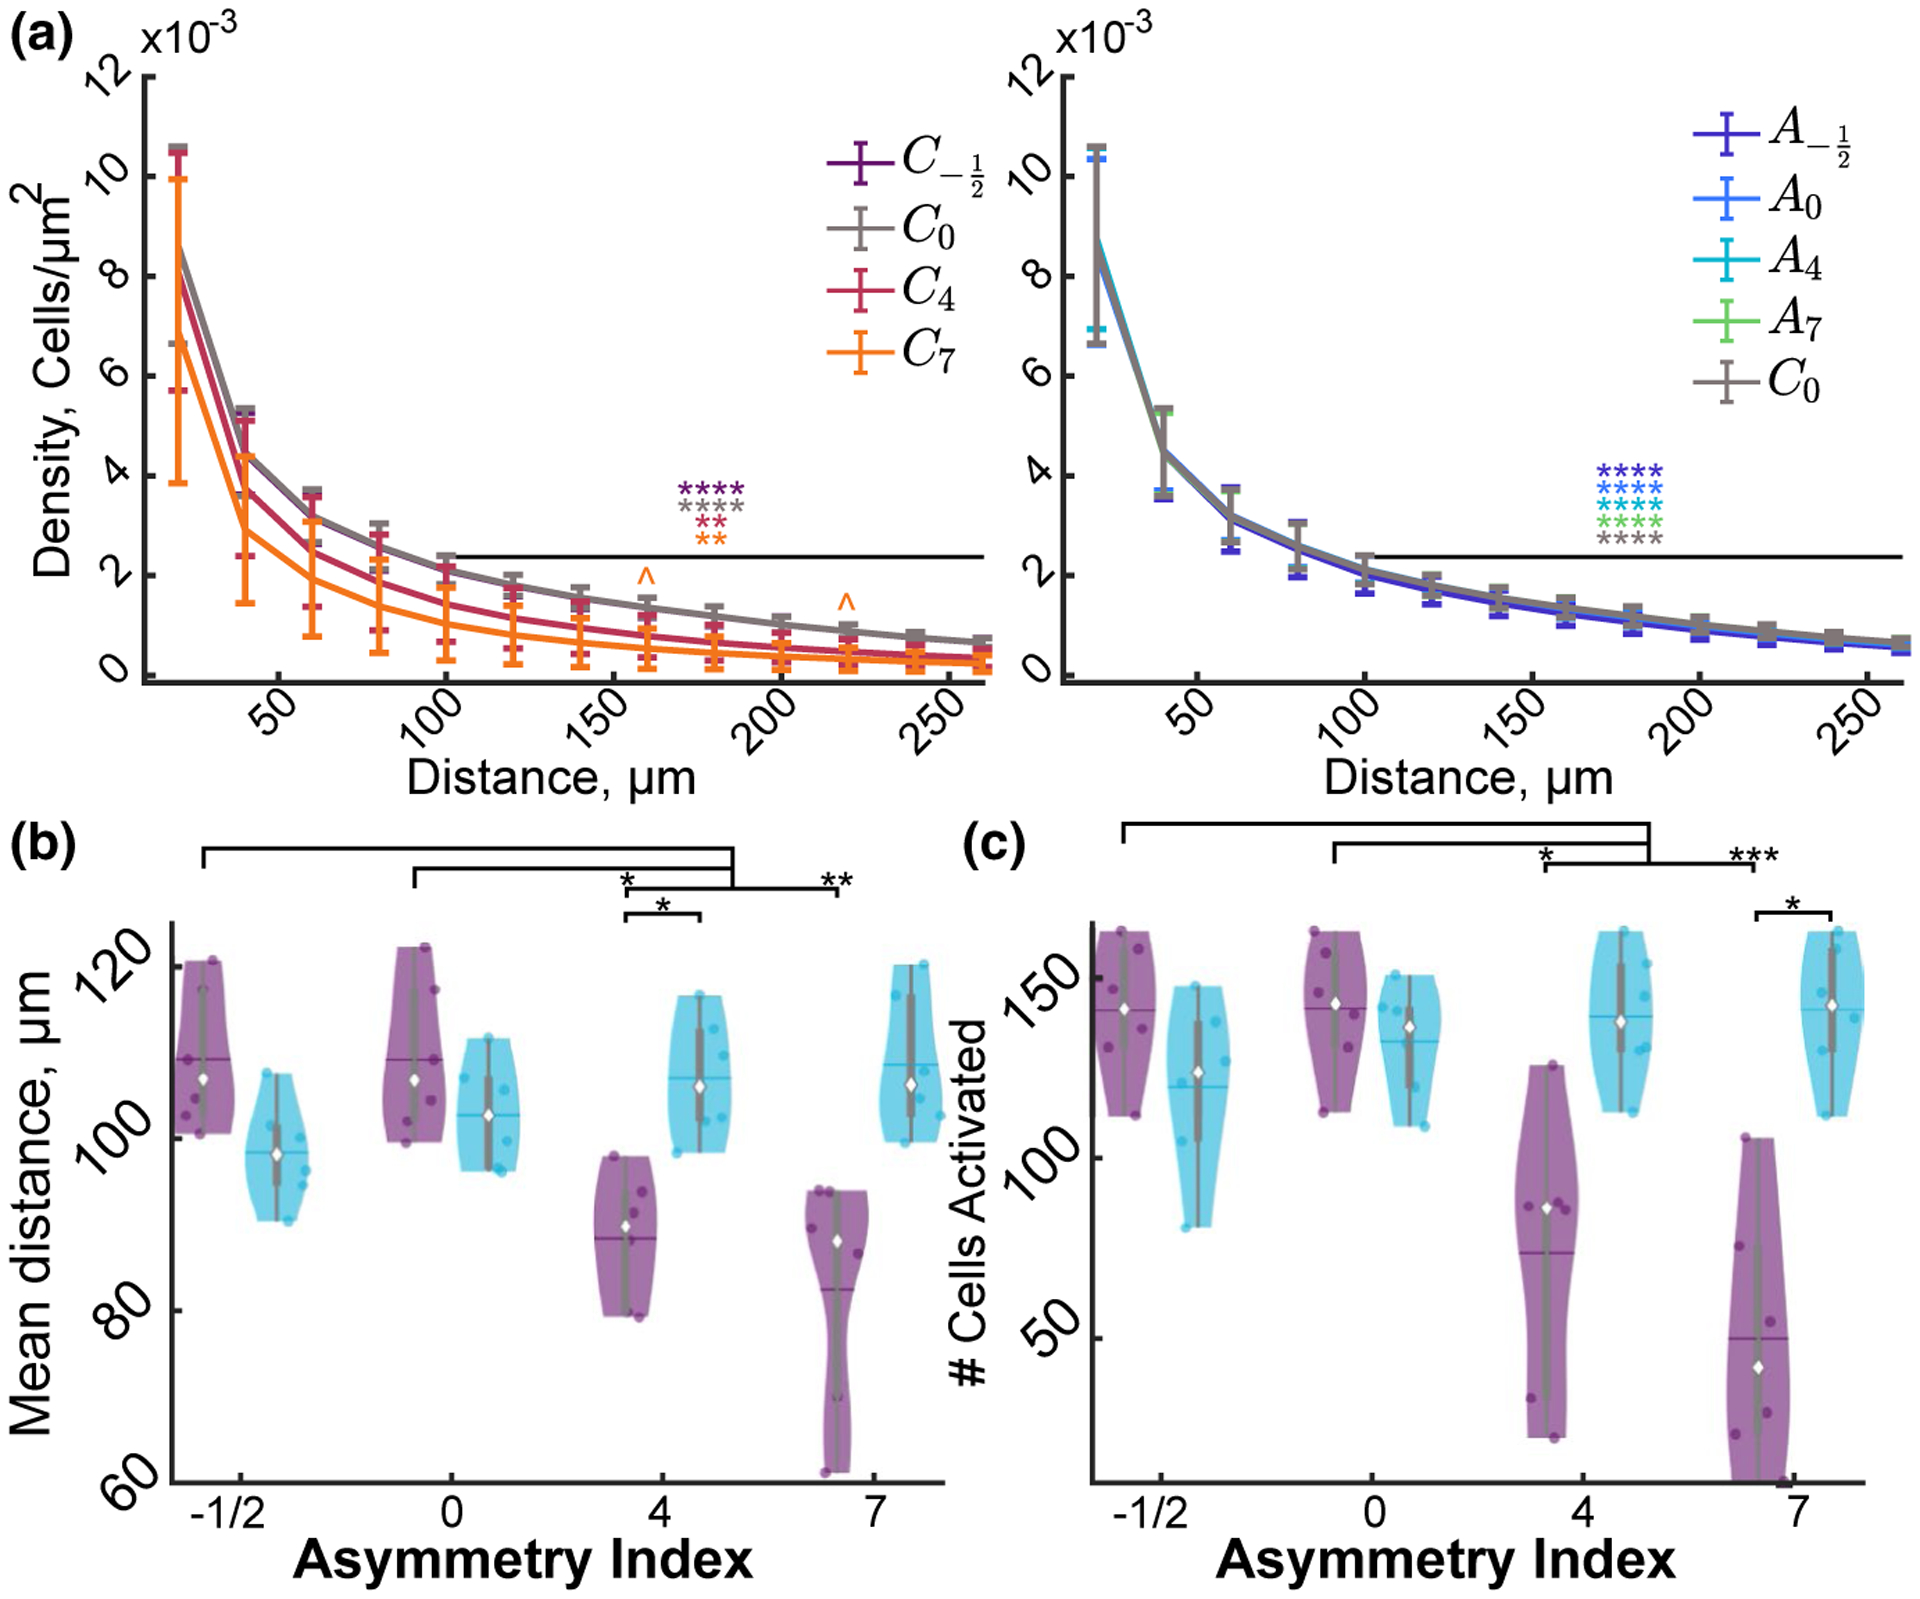
FIGURE 6.

Stimulation asymmetry and polarity modulate the spatial distribution of neuronal activation. (a) The density of activated neurons within the first 40 μm of the electrode is significantly greater than the density of neurons beyond 40 μm in all conditions except C7 (F5, 36 = 3.77, n = 6, p < 1e–10). (b) The number of activated cells is activated in relatively even amounts within all conditions except C4 and C7 where the majority of activated neurons ~70% is within the first 106 μm. Data represented as mean ± STD (F5, 3 = 4.02, n = 6, p < 0.012). (c–d) Stimulation polarity and waveform modulate the mean distance of the activated neurons (F3, 15 = 27.84, n = 6, p < 1e–5) as well as the number (F0.78, 3.89 = 17.60, n = 6, p < 0.0053). Statistics were first assessed with a three-way rmANOVA (a,b) or a two-way rmANOVA (c,d) followed by post hoc Welch’s T-tests with Bonferroni–Holm correction * indicates p < 0.05, ** indicates p < 0.01, *** p < 0.0001, **** p < 1e–5, ^ indicate comparison to C0 p < 0.05
