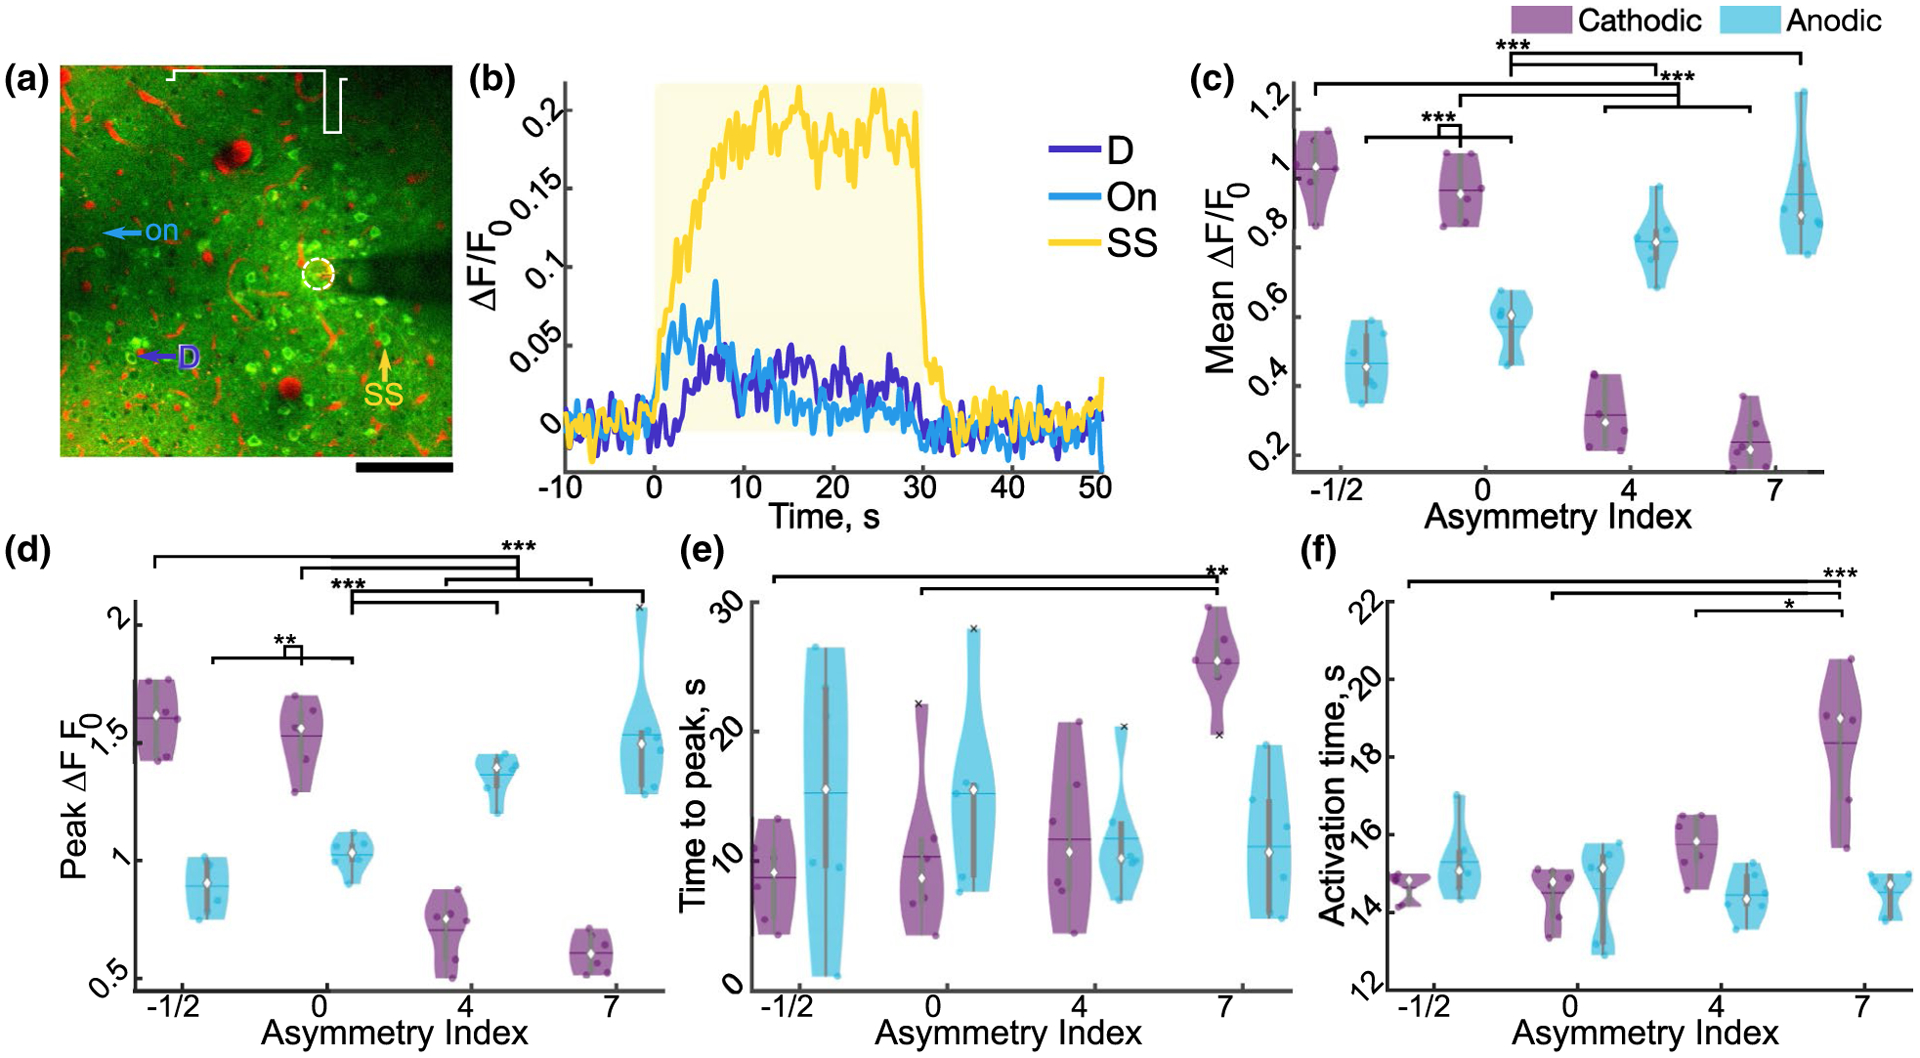
FIGURE 7.

Stimulation asymmetry and polarity modulate neuronal activity. (a) Representative standard deviation image of neurons activated by A7. (b) Representative traces of cells indicated in (a) for onset (On), steady state (SS), and delayed (D). Yellow rectangle indicates stimulation. (c–g) Mean (c, F3, 15 = 61.86, n = 6, p < 1e–7), peak (d; F0.95, 4.74 = 56.40, n = 6, p < 1e–4), and time to peak activation (e; F3, 15 = 11.10, n = 6, p < 0.001) of cells averaged for each animal. (k) Average weighted activation time of activated cells for each animal (F3, 15 = 10.96, n = 6, p < 0.001). Statistics were first assessed with a two-way rmANOVA followed by post hoc Welch’s T-tests with Holm correction: * indicates p < 0.05, ** indicates p < 0.01, ** indicates p < 0.001
