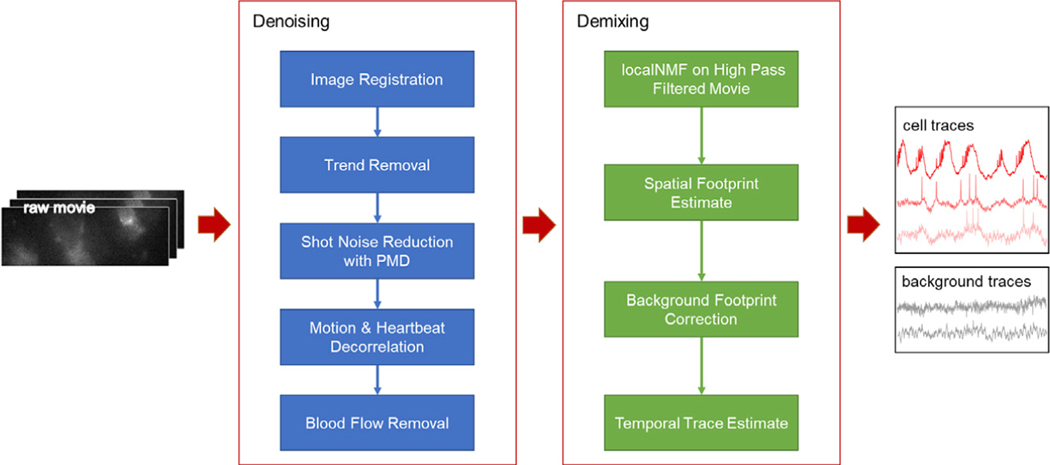
Figure 1. Pipeline for denoising and demixing in vivo voltage imaging data.
The denoising steps (blue) comprise a set of distinct corrections for the sources of statistical noise and systematic artifacts that can arise in vivo. The demixing steps (green) use action potentials to identify the cell footprints and the differing spatial profiles of in-focus versus out-of-focus sources to apportion subthreshold dynamics between cells and background.

