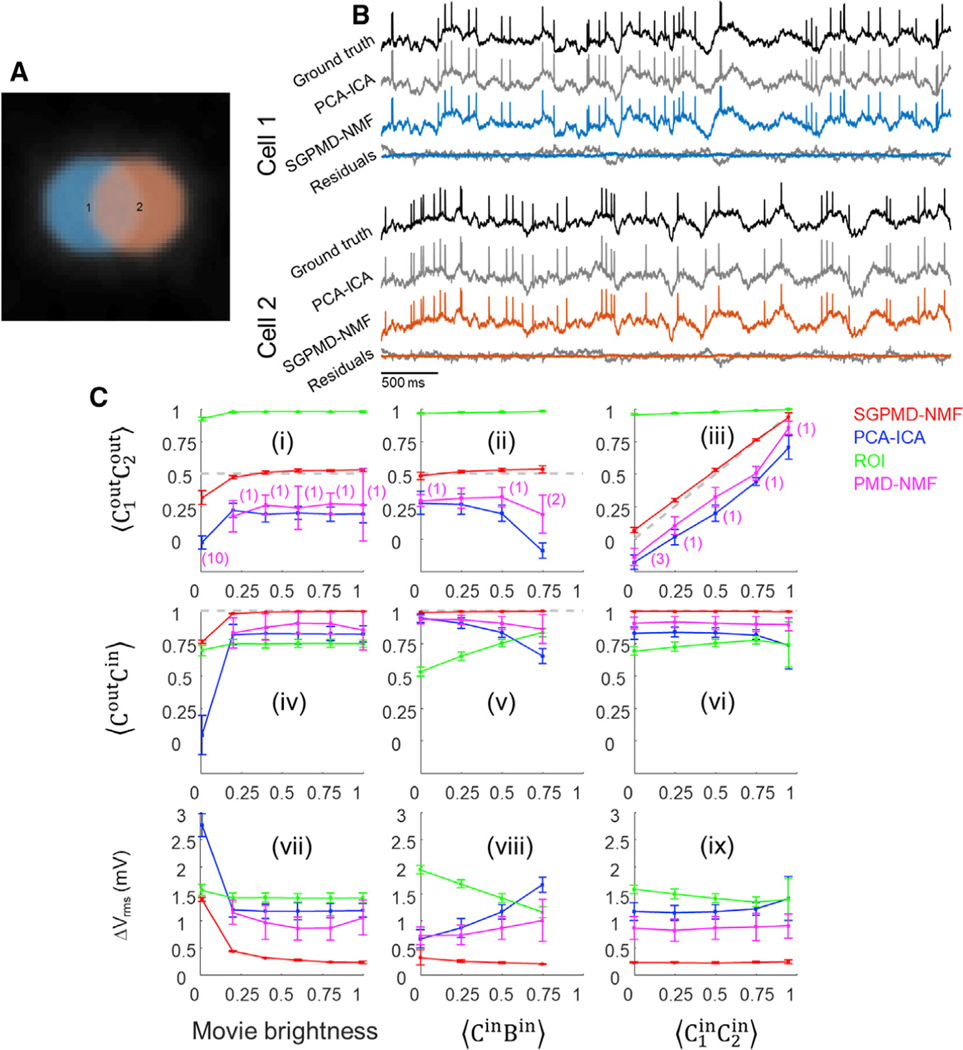
Figure 2. Validation of the SGPMD-NMF algorithm on simulated data.
(A) Example field of view comprising two simulated cells with spatial overlap and correlated subthreshold dynamics and a broad background whose dynamics were also correlated with each of the cells.
(B) Comparison of signal extraction via PCA-ICA versus SGPMD-NMF. The signals extracted via SGPMD-NMF were substantially closer to the ground truth than were the signals extracted via PCA-ICA.
(C) Quantification (mean ± SD) of SGPMD-NMF performance as a function of signal characteristics compared with PCA-ICA, ROI average, and PMD-NMF. Here is the cross-correlation of X and Y, C1 and C2 are the signals of the two cells, and B is the background. When subscripts are omitted, the calculation is averaged over both cells. Superscripts ‘‘in’’ and ‘‘out’’ refer to the ground truth voltage input and the extracted fluorescence output, respectively. ΔVrms is the root-meansquare voltage difference between extracted signal and ground truth voltage (lower values indicate better performance). In (i), (ii), (iv), (v), (vii), and (viii), (gray dashed line; closer proximity to this line indicates better performance). In (ii), (iii), (v), (vi), (viii), and (ix), movie brightness = 1. In a few trials, PMD-NMF failed to converge and the results were omitted. The number of such trials is listed in the first row in parentheses and applies to plots in the second and third rows.

