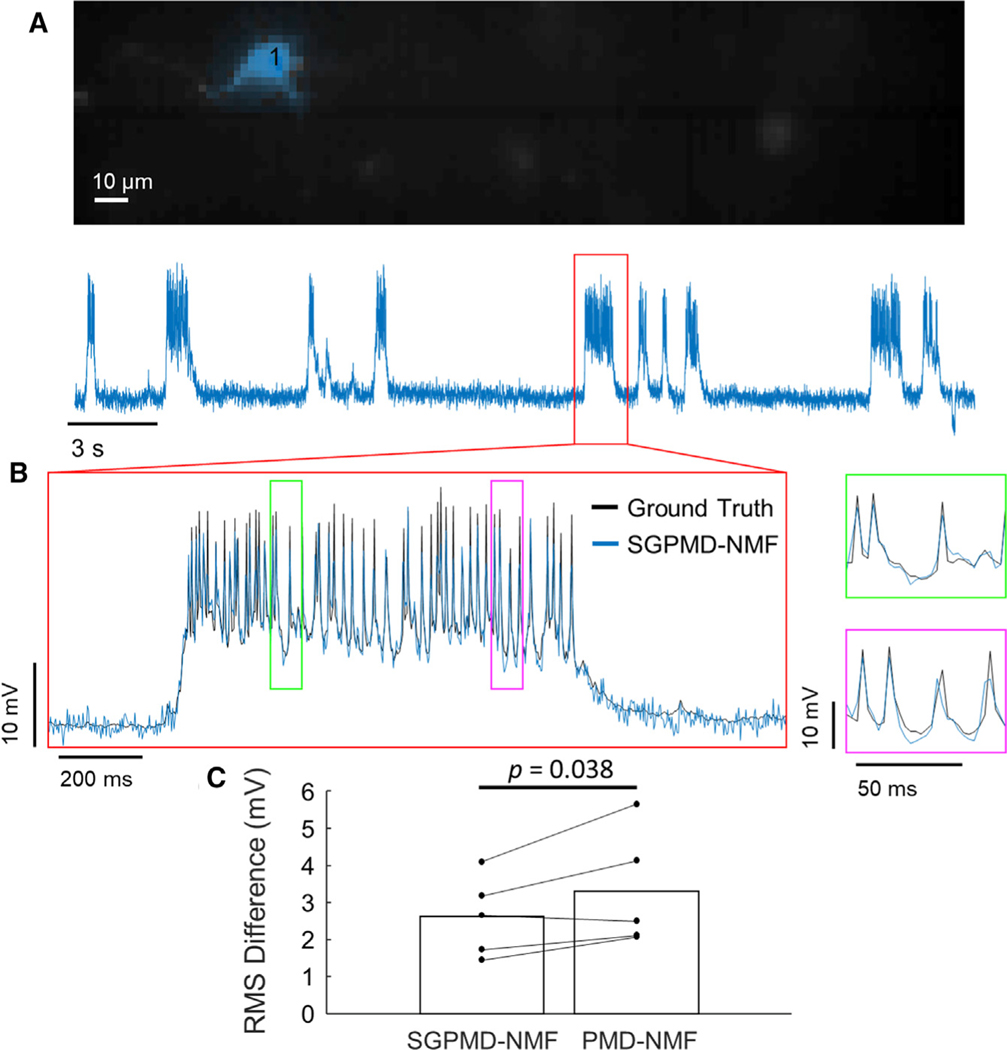
Figure 3. Validation of SGPMD-NMF with in vivo electrophysiology.
(A) Spatial footprint (top) and signal (bottom) extracted from an in vivo voltage imaging recording (mouse cortex L1 expressing Voltron) with simultaneous patch clamp.
(B) Inset of signal shown in (A) with patch-clamp ground truth recording overlaid. Further insets are marked in green and magenta and shown to the right.
(C) RMS differences between electrophysiological ground truth and voltage imaging signal extracted by SGPMD-NMF (2.6 mV) and PMD-NMF (3.3 mV; mean displayed by bar, n = 5 independent recordings). p = 0.038, paired 1-sided t test.

