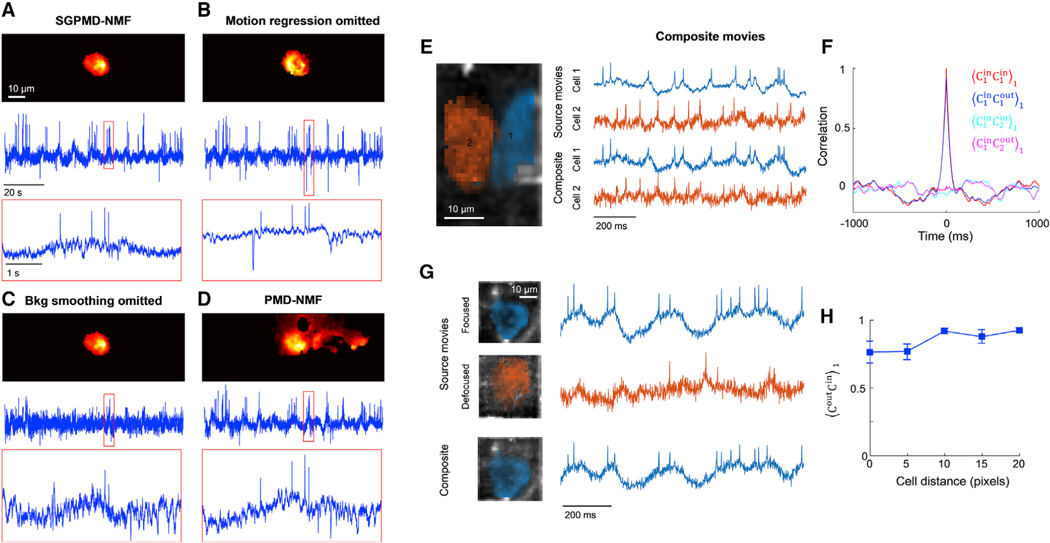
Figure 4. Validation of SGPMD-NMF algorithm against sources with motion, background, and overlapping cells.
(A–D) Four analyses of the same recording (mouse hippocampal CA1 pyramidal cells expressing SomArchon1). Top: image of the cell footprint. Middle: extracted fluorescence trace. Bottom: close-up of the fluorescence in the boxed region.
(A) Full SGPMD-NMF.
(B) SGPMD-NMF with the motion regression step omitted.
(C) SGPMD-NMF with the background smoothing step omitted.
(D) PMD-NMF.
(E) Left: composite movies were formed by adding two separately acquired single-cell movies (mouse hippocampal CA1 oriens interneurons expressing paQuasAr3-s) with a 20-pixel lateral offset between the cells. Right: signals were extracted from the source movies individually and from the composite movie jointly.
(F) Temporal cross-correlations of input and output traces showed good fidelity of extracted relative to input traces. Here is the cross-correlation of X and Y normalized by its value at a lag-1 time step (see STAR Methods for details). Shadings show mean ± SEM over 4 composite movies.
(G) Left: second set of composite movies was formed by adding two separately acquired single-cell movies of the same cell (mouse hippocampal CA1 oriens interneurons expressing paQuasAr3-s), one with the cell in focus and one with the cell 20 μm out of focus. The lateral offset between the two cells ranged from 0 pixels to 20 pixels. Right: signals were extracted from the source movies individually and from the composite movie jointly. In the composite movie, only the in-focus cell was extracted as a cell signal, and the out-of-focus cell was treated as background.
(H) Correlation of output traces with corresponding input traces as a function of overlap between the two cells. Error bars show mean ± SEM over 4 composite movies.

