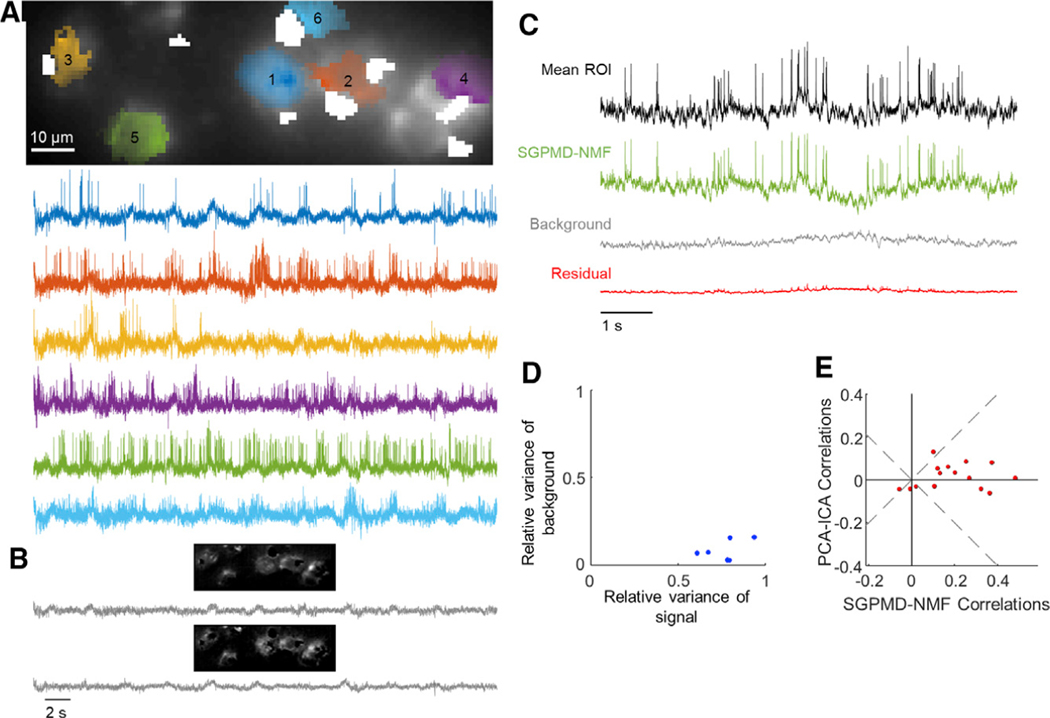
Figure 5. Voltage imaging in the mouse hippocampus CA1 pyramidal cell layer (PCL) using SomArchon1.
Cells expressed SomArchon1 and were imaged via micromirror-based, soma-targeted, structured illumination.
(A) Top: image of the field of view, showing dense neurons as occurs in the pyramidal cell layer of CA1. The cell footprints are overlaid. Regions contaminated by blood flow are masked in white. Bottom: extracted single-cell traces. Subthreshold depolarizations clearly coincided with elevated spike rates, giving confidence that the subthreshold waveforms reflect membrane potential.
(B) Background components from SGPMD-NMF. The two components that explained the most variance in the movie are included, with each component’s spatial profile above the corresponding temporal trace.
(C) Average across pixels in cell 5 in the denoised movie (mean ROI), SGPMD-NMF reconstructed signal movie (SGPMD-NMF), reconstructed background movie (background), and residual movie (residual).
(D) Scatterplot of the relative variance of each cell background versus signal.
(E) Comparison of the pairwise cell-cell cross-correlations between SGPMD-NMF and PCA-ICA. Most (12 of 15) pairwise correlations had a smaller magnitude for PCA-ICA versus SGPMD-NMF.

