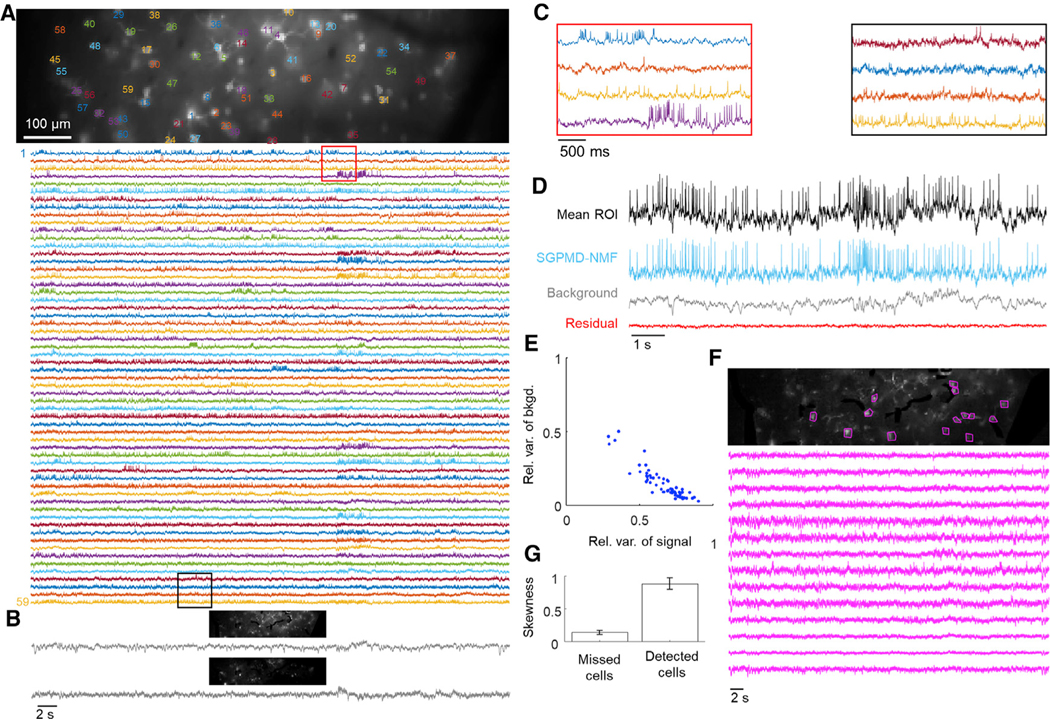
Figure 6. Voltage imaging in mouse cortex L1 using Voltron.
Cells expressed Voltron and were imaged via wide-field epifluorescence.
(A) Top: image of the field of view. The cells are labeled at the centroid of their footprints. Bottom: extracted single-cell traces. Insets shown in (C) are marked in red and black.
(B) Background components from SGPMD-NMF. The two components that explained the most variance in the movie are included, with each component’s spatial profile above the corresponding temporal trace.
(C) Inset of eight single-cell traces over a window of approximately 3 s.
(D) Average over pixels in cell 6 in the denoised movie (mean ROI), SGPMD-NMF reconstructed signal movie (SGPMD-NMF), reconstructed background movie (background), and residual movie (residual).
(E) Scatterplot of the relative variance of each cell background versus signal. Anticorrelation between relative variance of background and signal results because together, background and signal account for >99% of the total variance. If background and signal were uncorrelated, they would fall along the line x + y = 1. Deviations below the line x + y = 1 indicate positive correlation between signal and background.
(F) Top: SD image of the reconstructed sum of background and residual. Magenta masks indicate 14 manually selected bright spots, or missed cells. Bottom: mean ROI (on denoised movie) of the 14 missed cells. These traces showed little or no spiking activity.
(G) Skewness of temporally high-pass-filtered mean ROI traces (on denoised movie) of the 14 missed cells and 59 detected cells. Skewness provides a measure of spiking activity relative to baseline noise. Error bars show mean ± SEM. The missed cells displayed substantially less spiking activity compared with the detected cells.

