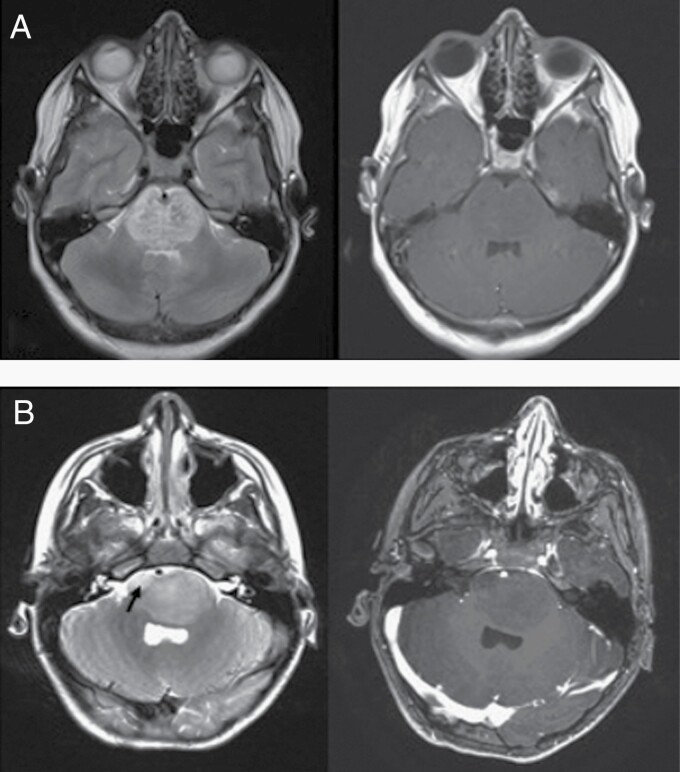
Figure 2.
A visual example of MRI radiomics. Example axial T2 (left) and T1 (right) MRI for 2 children. T2-weighted MR images of a patient who survived 20 months (A) and a patient who survived only 3 months (B) show heterogeneous or coarse intensity distribution with punctate foci of dark signal interspersed within T2 hyperintensities in the patient (A) compared to (B), where more confluent intensities are seen with a more localized T2 hyperintense soft tissue abnormality in right anterior pons (arrow). The T1 post-contrast MRI demonstrates limited qualitative characteristics of the tumor.

