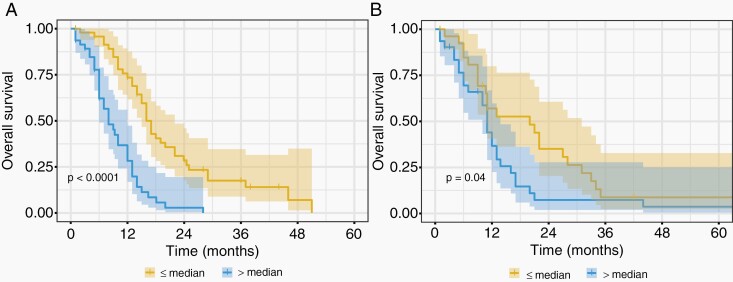
Figure 3.
Kaplan–Meier curves for the Cox regression model including radiomics and clinical features in (A) the training dataset (n = 95, log-rank P < .0001) and (B) the testing dataset (n = 58, log-rank P = .04). Patients were stratified on the basis of the median risk value in the training dataset and the shaded regions represent the 95% confidence intervals.

