
Extended Data Fig. 5. Known marker genes compared to the best gene, related to Results: Identifying novel layer-enriched genes in human cortex.
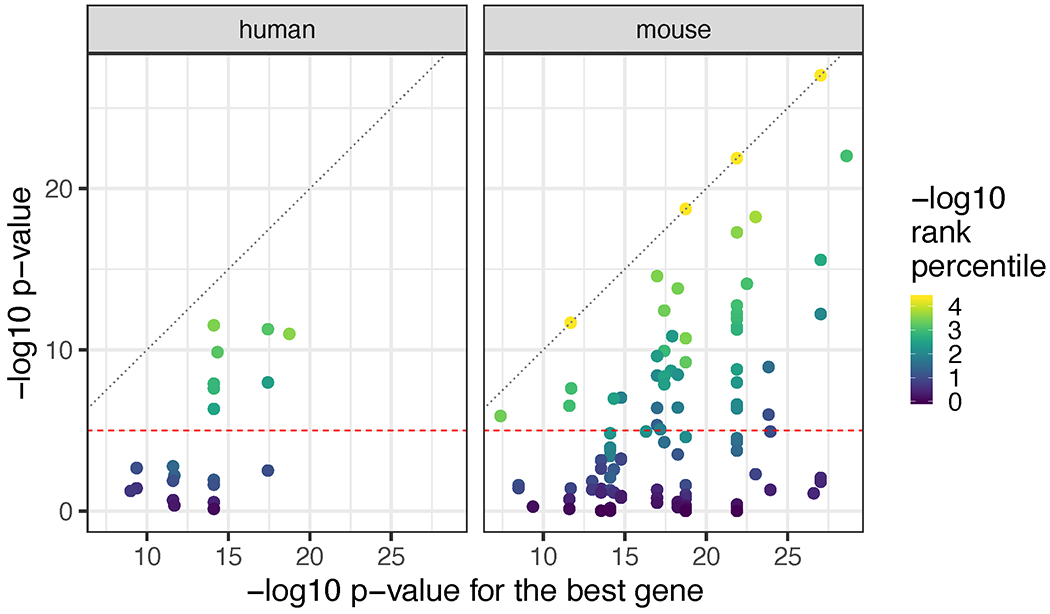
Using the optimal models (Method Details: Known marker genes optimal modeling) for each known marker gene we compared the marker genes against the best gene for that given model. Results are visualized using the −log10 p-values for the marker gene (y-axis) against the best gene for that model (x-axis). Points are colored by the −log10 rank percentile of that gene in such a way that the top ranked gene is −log10(1 / 22,331) and colored in yellow.