
Extended Data Fig. 6. Replication of Visium layer-enriched genes by Allen Brain Atlas in situ hybridization (ISH) data, Related to Figure 3.
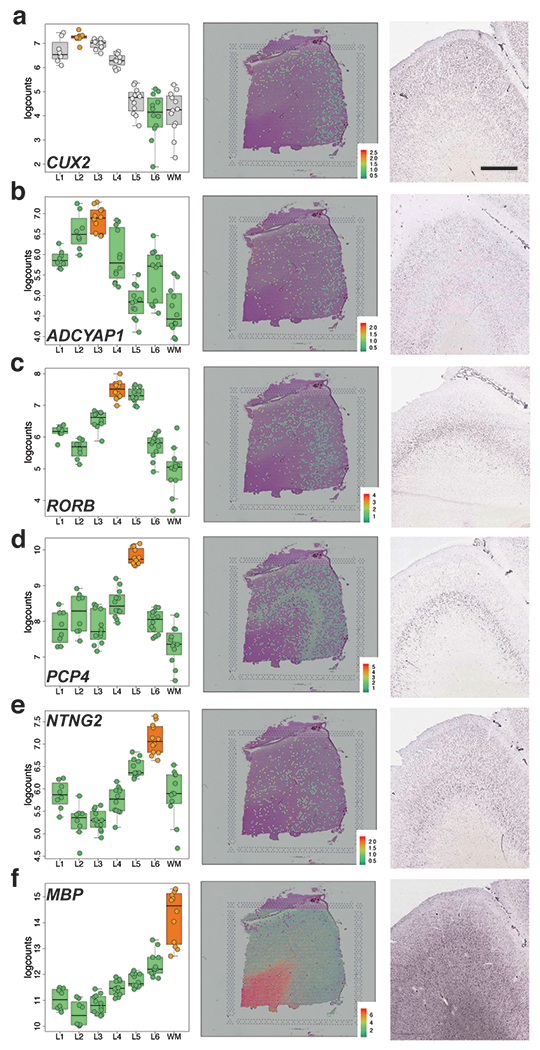
(A-F) Left panels: Boxplots of log-transformed normalized expression (logcounts) for genes CUX2 (A, L2>L6, p=3.75e-19), ADCYAP1 (B, L3>rest, p=3.57e-08), RORB (C, L4>rest, p=2.91e-07), PCP4 (D, L5>rest, p=1.81e-19), NTNG2 (E, L6>rest, p=5.22e-13), and MBP (F, WM>rest, p=1.71e-20). Middle panels: Spotplots of log-transformed normalized expression (logcounts) for sample 151673 for CUX2 (A), ADCYAP1 (B), RORB (C), PCP4 (D), NTNG2 (E), and MBP (F). Right panels: in situ hybridization (ISH) images from DLPFC (A, C, D, E, F) or frontal cortex (B) of adult human brain from Allen Brain Institute’s Human Brain Atlas: http://human.brain-map.org/ 33. Scale bar for Allen Brain Atlas ISH images=1.6mm. 76 pseudo-bulked layers were used for computing the statistics in A-F.