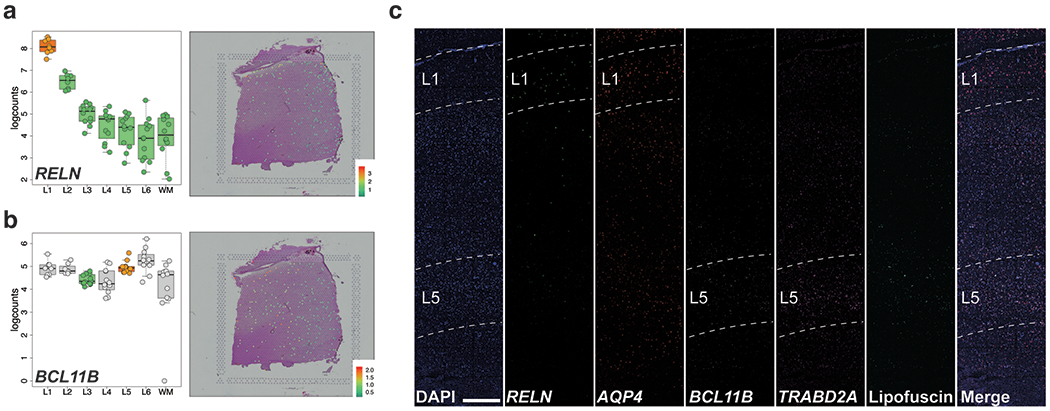
Extended Data Fig. 7. smFISH validation of L1- and L5-enriched genes, related to Figure 4.

(A-B) Left panels: Boxplots of log-transformed normalized expression (logcounts) for previously identified L1 and L5 marker genes RELN (A, L1>rest, p=7.94e-15,) and BCL11B (B, L5>L3, p=4.44e-02), respectively. Right panels: Spotplots of log-transformed normalized expression (logcounts) for sample 151673 for genes RELN (A) and BCL11B (B). Corresponding boxplots and spotplots for Visium-identified genes AQP4 and TRABD2A in Figure 4. (C) Multiplex single molecule fluorescent in situ hybridization (smFISH) in a cortical strip of DLPFC. Maximum intensity confocal projections depicting expression of DAPI (nuclei), RELN (L1), AQP4 (L1), BCL11B (L5), TRABD2A (L5) and lipofuscin autofluorescence. Merged image without lipofuscin autofluorescence. Scale bar=500μm. 76 pseudo-bulked layers were used for computing the statistics in A-B.
