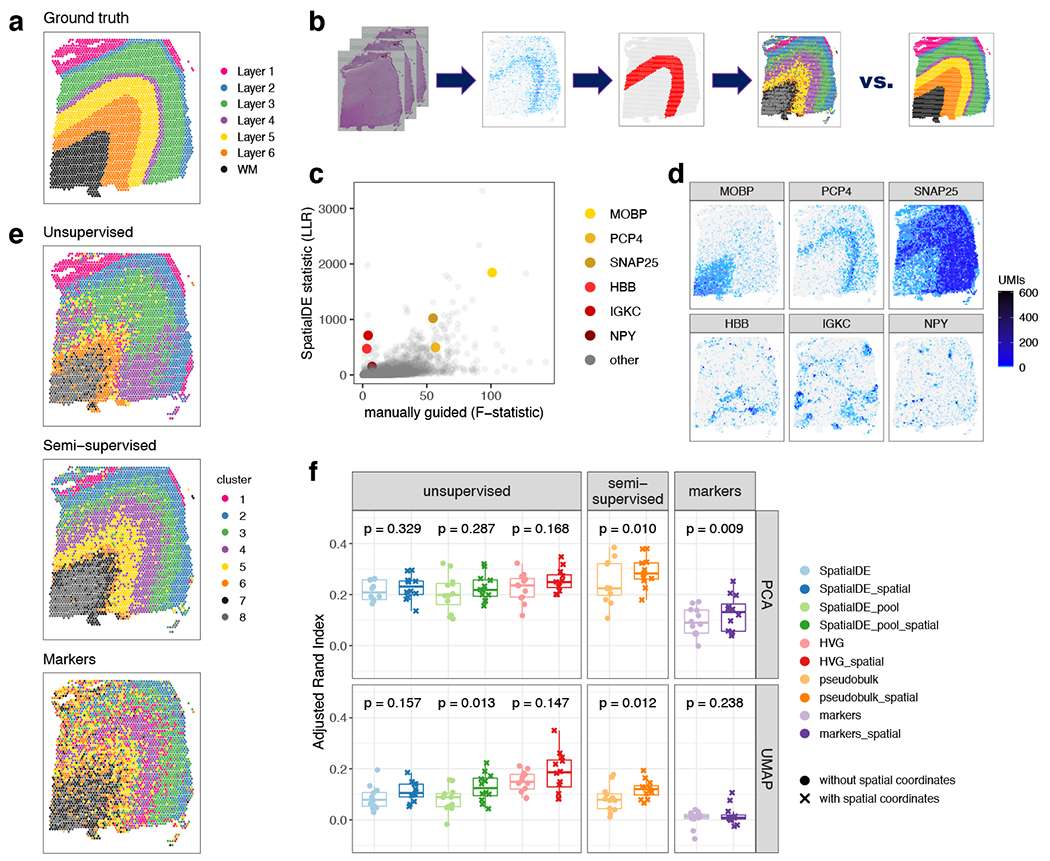
Figure 7: Data-driven layer-enriched clustering in the DLPFC.

(A) Supervised annotation of DLPFC layers based on cytoarchitecture and selected gene markers (as shown in Figure 2A), used as ‘ground truth’ to evaluate the data-driven clustering results, for sample 151673. (B) Schematic illustrating the data-driven clustering pipeline, consisting of: (i) identifying genes (HVGs or SVGs) in an unbiased manner, (ii) clustering on these genes, and (iii) evaluation of clustering performance by comparing with ground truth. (C) Comparison of gene-wise test statistics for SVGs identified using SpatialDE (log-likelihood ratio, LLR) and genes from the DE ‘enrichment’ models (Extended Data 4) (F-statistics; WM included) for sample 151673. Colors indicate selected genes with laminar (yellow shades) and non-laminar (red shades) expression patterns. (D) Expression patterns for selected laminar (top row) and non-laminar (bottom row) genes identified using SpatialDE (corresponding to highlighted genes in (C)) in sample 151673. (E) Visualization of clustering results for the best-performing implementations of: (i) ‘unsupervised’ clustering (method ‘HVG_PCA_spatial’, which uses highly variable genes (HVGs) from scran, 50 principal components (PCs) for dimension reduction, and includes spatial coordinates as features for clustering); (ii) ‘semi-supervised’ clustering guided by layer-enriched genes identified using the DE enrichment models; and (iii) clustering guided by known markers from Zeng et al. 32 (Method Details: Data-driven layer-enriched clustering analysis and Table S10). (F) Evaluation of clustering performance for all methods across all 12 samples, using manually annotated ground truth layers (as in (A)) and adjusted Rand index (ARI). Points represent each method and sample, with results stratified by clustering methodology (Method Details: Data-driven layer-enriched clustering analysis and Table S10). P-values represent statistical significance of the difference in ARI scores when including the two spatial coordinates as features within the clustering, using a linear model fit for each method (overall model across all methods: p=5.8e-6). See also Supplementary Figure 11, Extended Data 9, Extended Data 10,Table S9, and Table S10.
