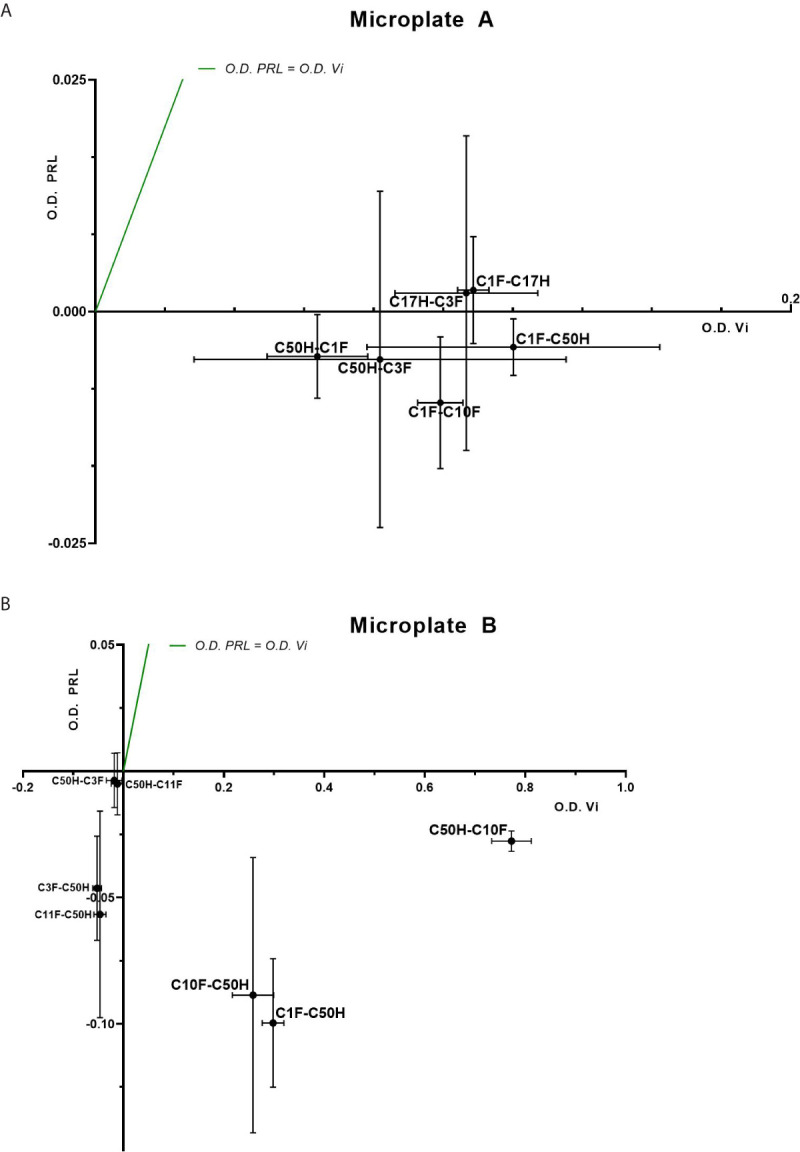
Figure 3.

Sandwich ELISA of vasoinhibin and PRL with vasoinhibin-specific monoclonal antibodies. Plots of sandwich ELISA with anti-vasoinhibin monoclonal antibodies showing the affinity with vasoinhibin (1.0 µg/ml) (x-axis) and PRL (1.0 µg/ml) (y-axis). The center point of each cross is the mean O.D. value of the triplicate measurement, and the lines show the range of the standard deviation. The green line represents the signal localization of the cross centers in case of equal affinity against vasoinhibin and PRL. (A) shows sets of antibody pairs tested on Microplate A, each pair is indicated as a cross with mean and standard deviation. (B) shows the affinity of another set of antibody pairs on Microplate B with suitable affinities that do not recognize PRL. Affinities in the negative scale of the PRL y-axis are a result of wells containing PRL standard being even less reactive than blank wells. Sandwiches C10F-C50H, C1F-C50H, and C50H-C10F show high affinity to vasoinhibin and no affinity to PRL.
