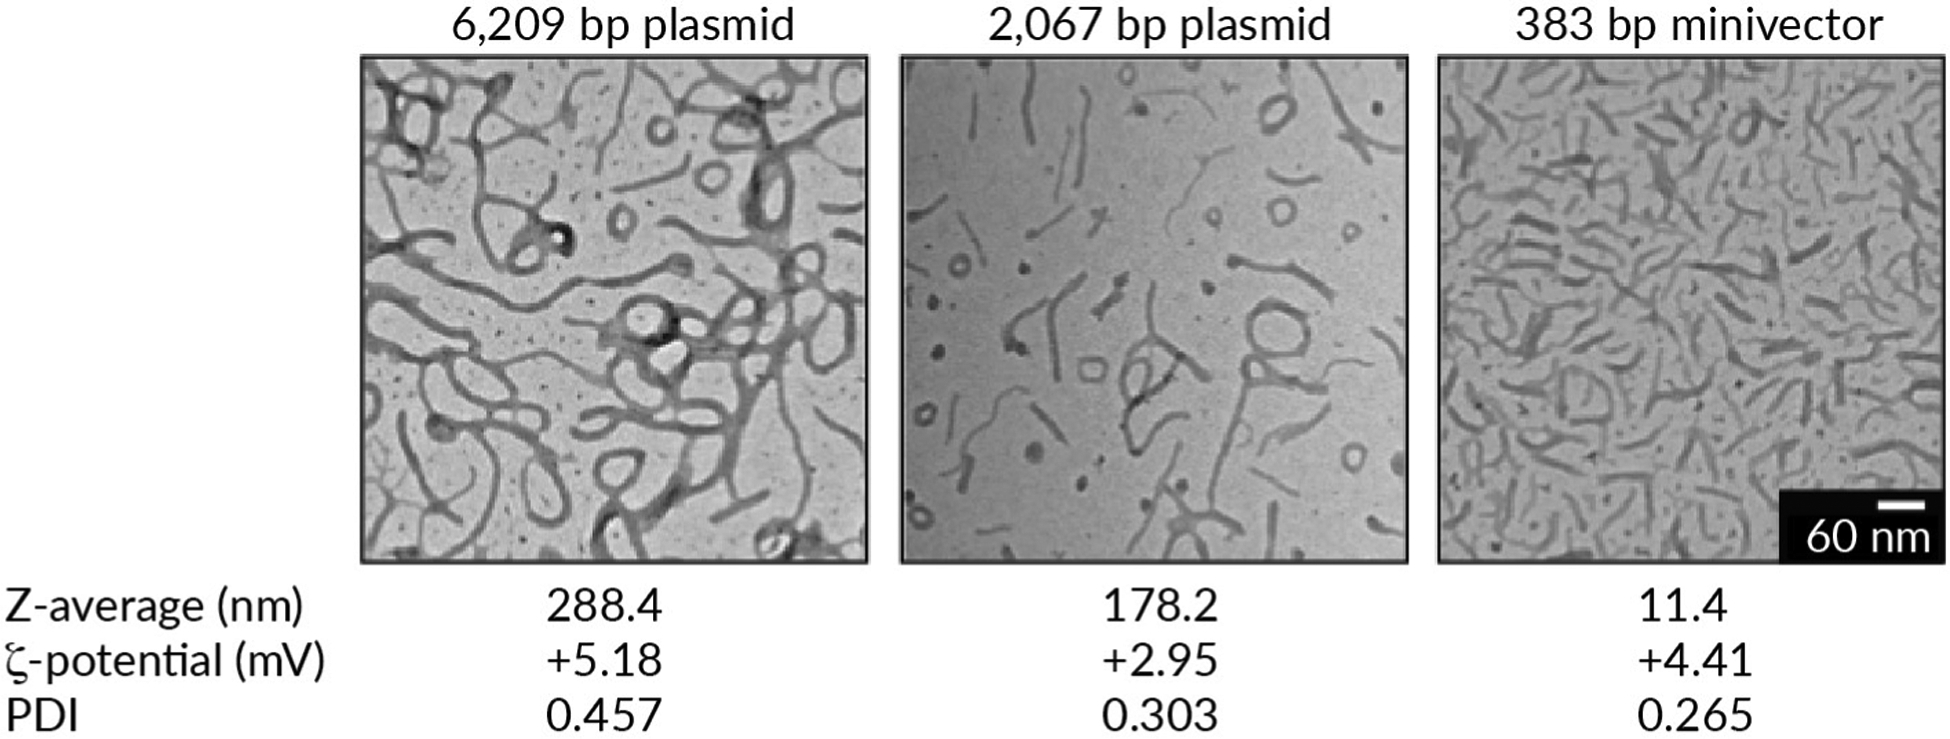
FIGURE 1. Transmission electron micrographs of three DNA vector sizes.

Poly-L-lysine-polyethylene glycol and DNA were complexed at a nitrogen:phosphate ratio of 2:1. Z-average (a measure of particle size), ζ-potentials (a measure of the degree of electrostatic repulsion between adjacent particles), and polydispersity index (PDI, a measure of the amount of variability in the particle size distribution) values were determined using dynamic light scattering using a Malvern Zetasizer Nano (data courtesy of Dr Jin Wang, Dr Fude Feng, and Dr. Daniel J Catanese, Jr.).
