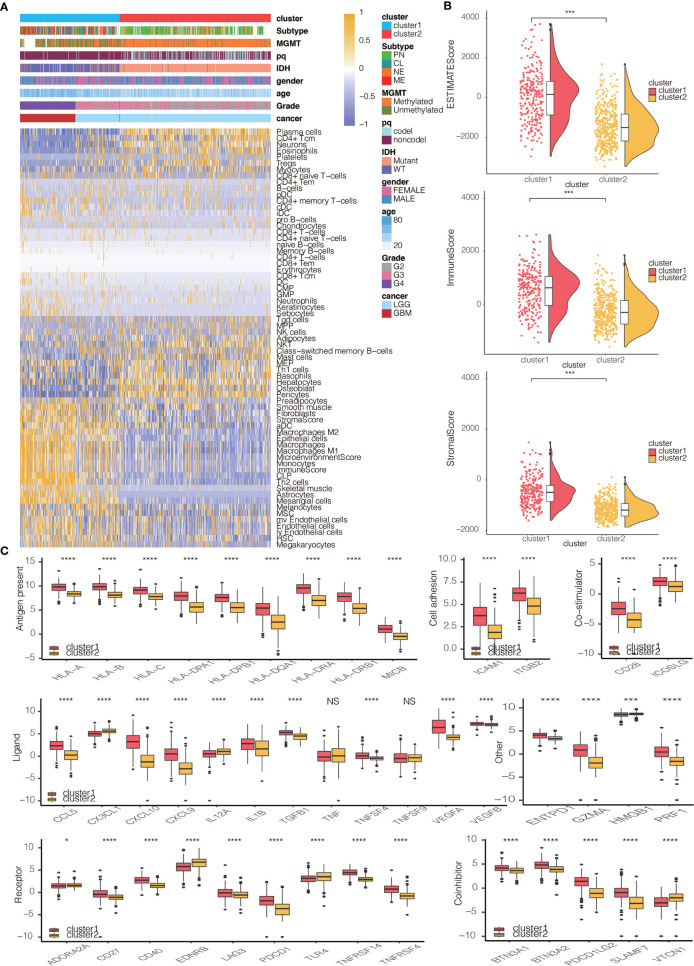
Figure 3.
Immune characteristics of the two clusters. (A) Dendrogram correlating the levels of 64 cell types calculated by xCell and clusters in TCGA. (B) ESTIMATEScores, ImmuneScores and StromalScores of the two clusters in TCGA. (C) Molecule levels of seven types of immune checkpoints in two clusters in TCGA. *P < 0.05, ***P < 0.001, ****P < 0.0001. NS, not statistically significant.

