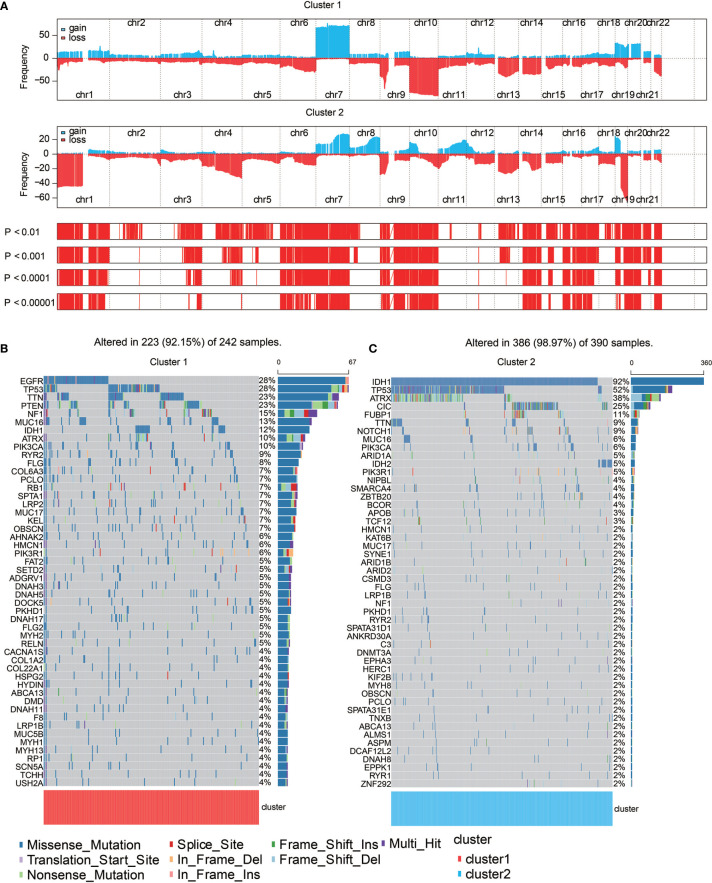
Figure 4.
Genomic features of the two clusters. (A) Distribution of gain or loss of function mutation in the 22 human chromosomes in the two clusters. Amplification of genes is marked in blue. Deletion of genes is marked in red. (B) List of the most frequently altered genes in clusters 1. (C) List of the most frequently altered genes in clusters 2. Nine mutation types were exhibited.

