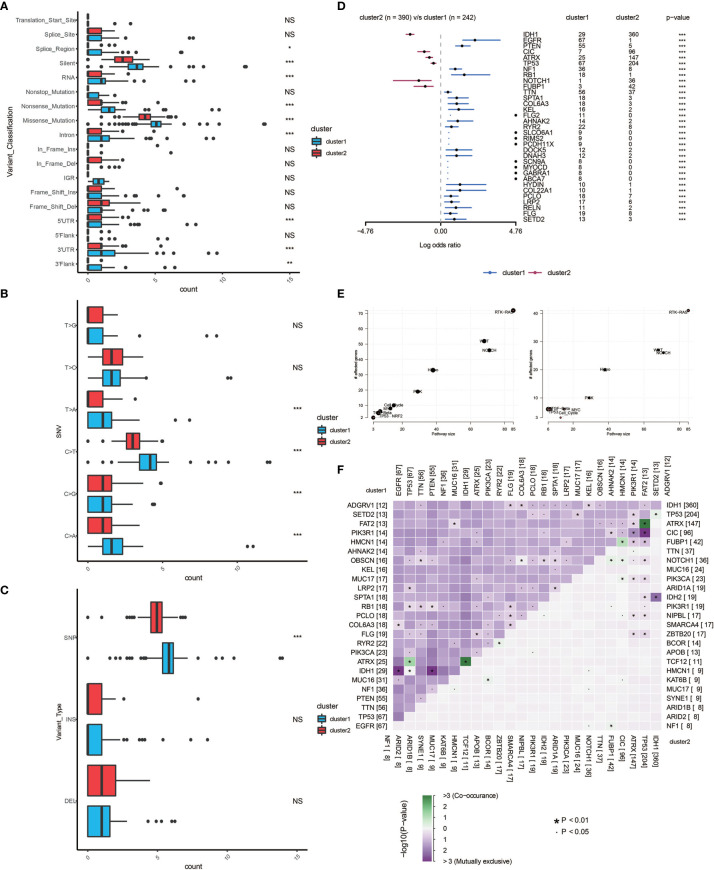
Figure 5.
Genomic alterations in the two clusters. Frequency comparison according to types of mutation (A), SNV (B), INDEL and SNV (C) between the two clusters. (D) The Forest plot listing the top 17 most mutated genes between the two clusters. (E) Demonstration of the pathways involved in cancer biology in the two clusters. (F) The heatmap showing the concurrence or mutual exclusivity of the top 25 most mutated genes in the two clusters. *p < 0.05, *p < 0.01, ***P < 0.001, ****P < 0.0001. NS, not statistically significant.

