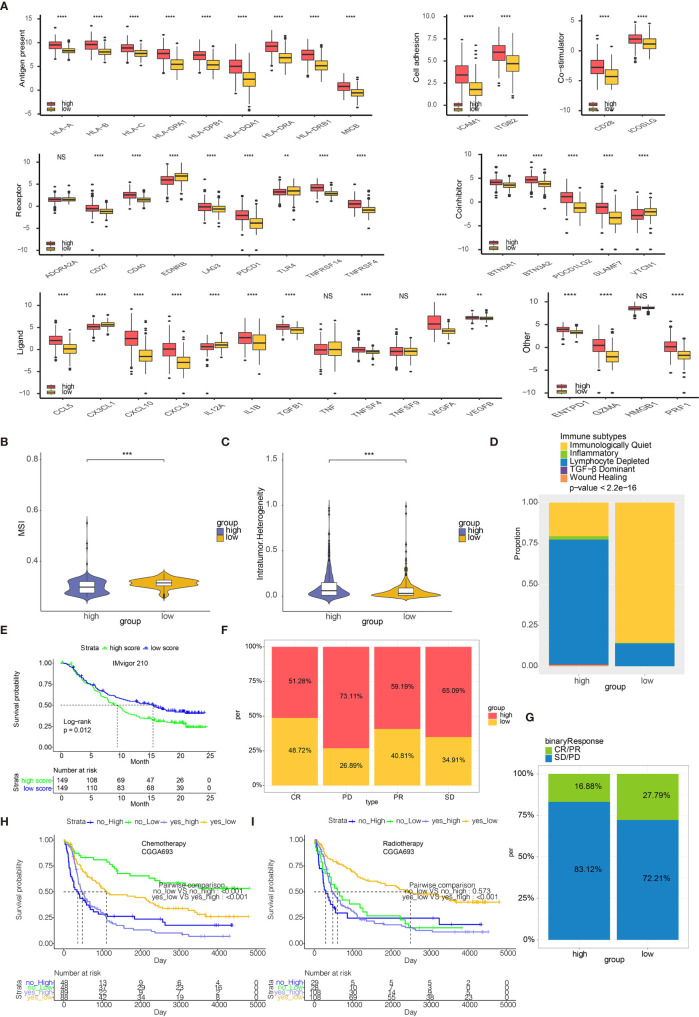
Figure 7.
Risk scores predict immunotherapy response. (A) Molecule levels of immune checkpoints in two risk score groups in TCGA. (B) MSI in high and low risk score. (C) Intratumor Heterogeneity in high and low risk score. (D) Distribution of six immune subtypes in two risk score groups in TCGA. (E) Kaplan-Meier curve of high and low risk score groups in IMvigor210 cohort. (F) The bar chart showing proportions of high and low risk scores. (G) The bar chart showing proportions of CR/PR and SD/PD patients in high and low risk score groups. (H) Kaplan-Meier curve of high and low risk score groups in patients receiving chemotherapy from CGGA693. (I) Kaplan-Meier curve of high and low risk score groups in patients receiving radiotherapy from CGGA693. **P < 0.01, ***P < 0.001, ****P < 0.0001. NS, not statistically significant.

