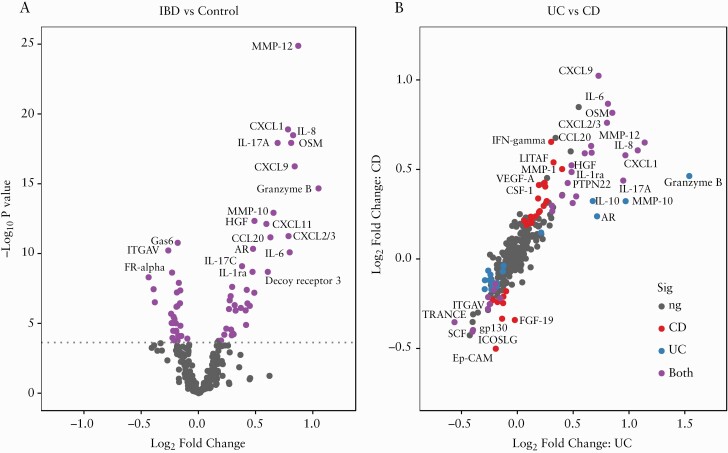
Figure 1.
[A] Volcano plot displaying the log2 fold-change and significance of protein associations with IBD. Dotted line indicates the threshold for significance [Holm p < 0.05] after Holm correction derived from −log10[uncorrected p = 1.78 × 10⁻⁴]. [B] Fold change between ulcerative colitis [UC] and Crohn’s disease [CD] respectively vs controls; points are coloured by significance after Holm correction in CD, UC, both or neither [ns].

