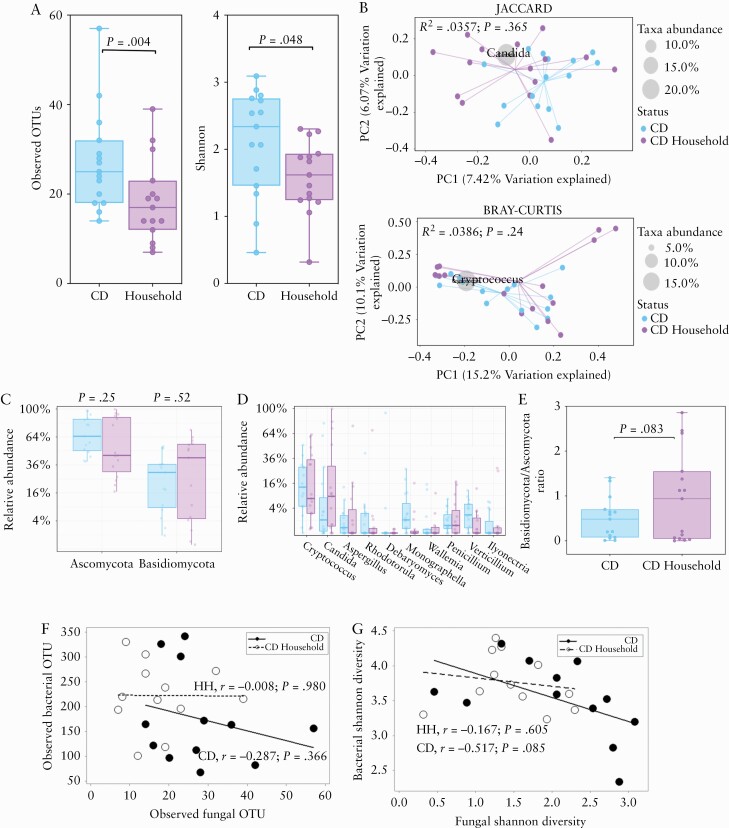
Figure 3.
Altered mycobiota diversity in CD patients during remission compared with household matched controls. A] Alpha-diversity metrics [observed OTUs and Shannon]. The centre line denotes the median, the boxes cover the interquartile range [Q1-Q3], and the whiskers extend to the most extreme data point, which is no more than 1.5 times the length of the box away from the box. Points outside the whiskers represent outlier samples. [The ranges and descriptive statistics are the same for panels C and D] B.] Beta-diversity metrics (Jaccard Index [presence/absence of fungal genera] and Bray_Curtis distance [relative abundance of fungal genera]). C] Relative abundance of Ascomycota and Basidiomycota. D] Percentage relative abundance of the top 10 most dominant fungal genera. E] Basidiomycota/Ascomycota ratio. The middle lines are the median ratio, the boxes cover the interquartile ranges [Q1-Q3]. The whiskers show the range from the minimum ratio to the maximum ratio. F] Association between bacterial and fungal OTUs in CD and non-CD [Spearman’s rank correlation test applied to both groups]. G] Association between bacterial and fungal Shannon diversity metrics in CD [Pearson’s correlation] and non-CD [Spearman’s rank correlation]. Where relevant, p-values were adjusted for multiple comparisons using FDR and considered significant if p <0.05. CD, Crohn’s disease; OTUs, observed taxonomic units; FDR, false-discovery rate.

