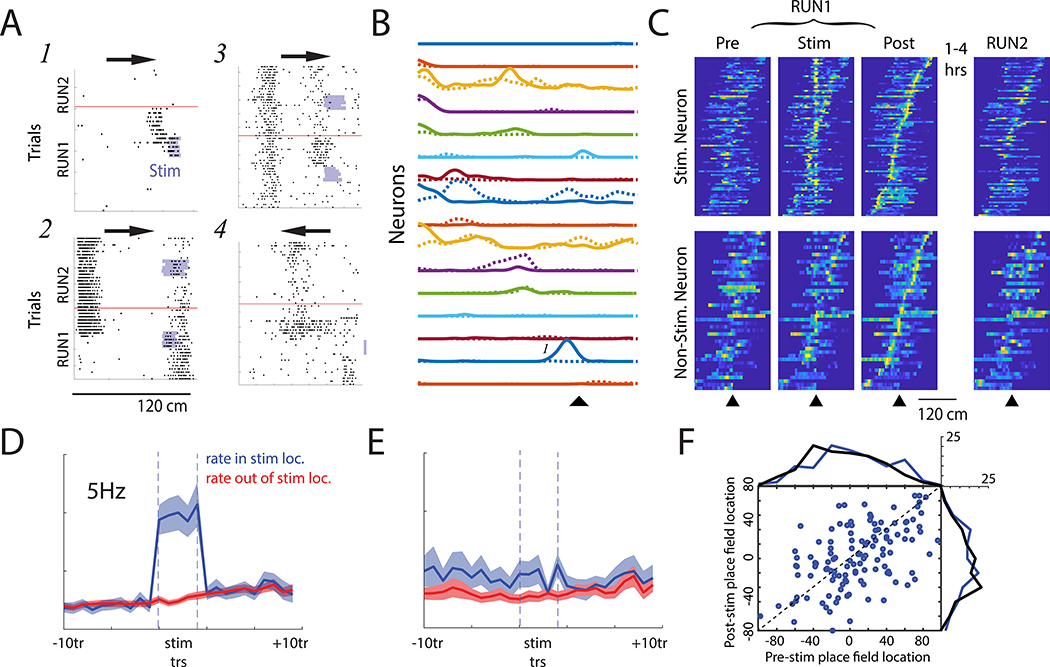
Figure 2. Optogenetically-induced place cell remapping is neither confined to stimulated neurons, nor the stimulation zone.
(A) Stimulation induced place field remapping after focal light delivery (light blue). Arrows show running direction. RUN1 and RUN2 sessions are separated by a horizontal red line. (1) Novel place field near the stimulation site. (2) Rate reduction of spiking within an existing place field and induction of a novel place field at a non-stimulated site. (3) Induced novel place field at stimulation location and persistence of an existing place field. (4) Induction of a novel place field observed on inbound runs, despite stimulation delivered during outbound traversals. (B) All place fields for an example stimulation session before (dashed) and after (solid) optogenetic stimulation. ▲ marks stimulation location. In the same session, some neurons shifted fields, some showed rate decreases, and some rate increases. Place field marked ‘1’ is the same as that shown in Panel A1. (C) Normalized place fields for all remapping neurons recorded on the stimulated and non-stimulated shanks. Place fields are centered on the stimulation location and plotted using spikes recorded before stimulation (pre), during stimulation trials (stim), directly after stimulation (Post), and during a follow-up track session after homecage recordings (RUN2). Place fields sorted by post-Stim peak firing location. (D) Mean firing rate of stimulated neurons within (blue) and outside (red) of the stimulation site before, during (between dashed lines), and after stimulation trials. Bar indicates p < 0.001 comparing firing rate on stimulated location versus the median rate in non-stimulated locations. (E) Same as Panel D for neurons recorded on the non-stimulated shank. (F) Place field location recorded prior to stimulation versus the Post-Stim location for remapping (blue) neurons. The distribution of place field centers pre- and post-Stim are shown for the remapping neurons (blue) and the stable (black) neurons for reference. Place field locations are centered on the Stim location. Note that place fields could remap to any location on the track and that there was no Post-stim over-representation of the stimulation site. See also Figure S2.

