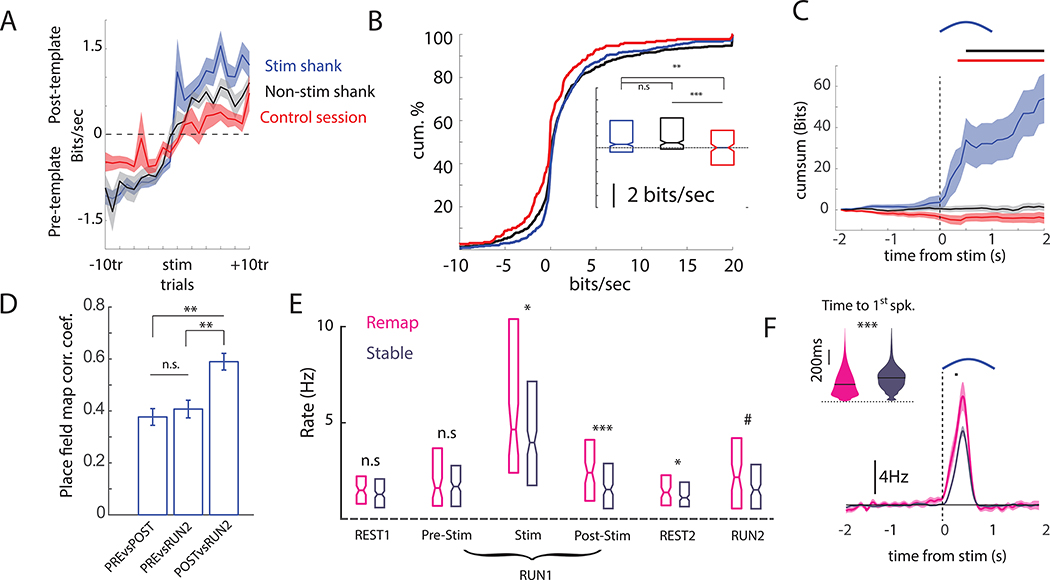
Figure 3). Focal optogenetic depolarization induces rapid remapping and persistent rate changes.
(A) Remapping was quantified as the log-likelihood difference between two models of single-cell spiking: one based on place fields recorded prior to stimulation (Pre-template), and another based on post-stimulation place fields (Post-template). The difference in log-likelihoods after stimulation gives gain/loss of information (Bit/sec) carried by the spike train about the post-stimulation place fields relative to pre-stimulation. Comparisons are made between neurons recorded on the stimulated shank and non-stimulated (neighboring) shanks in optogenetic session and identical Control session without optogenetic stimulation (B) The summed post-stimulation log-likelihood ratio (post – pre) was calculated for each neuron. The cumulative distribution of LL-ratios is given for neurons recorded on the stimulated shank (blue), non-stimulated shanks (black), and in Control sessions (red). Box plots show descriptive summaries for each group. (C) The mean ± SEM cumulative sum of the log-likelihood differences centered on stimulation for remapping cells. Soon after stimulation (400ms), neurons on the stimulated shank began to show spiking that was more consistent with post-stimulation place fields. Black bar indicates p < 0.01 comparing stimulated shank versus non-stim shank. Red bar indicates p < 0.01 comparing stimulated shank versus Control. (D) The place field stability (Pearson R) for remapping cells. Post-stim rate maps were more similar to RUN2 than the pre-stim rates. (E) The firing rates for remapping and stable cells during different segments of stimulation sessions. Remapping cells showed higher induced rates and higher rates in all post-stimulation epochs compared to stable cells. (F) The subset of neurons on the stimulated shank that remapped (pink) showed higher firing rates and shorter latencies to spike after stimulation (inset), as compared to stimulated neurons that maintained stable spatial firing fields (purple). Rate differences are calculated relative to the expected firing rates at those times given the pre-Stim place fields. Bar indicates p < 0.01 comparing firing rate of remapping versus stable cells. # p < 0.1, * p < 0.05, ** p < 0.01, *** p< 0.001. Shaded error bars = S.E.M. See also Figure S3.

