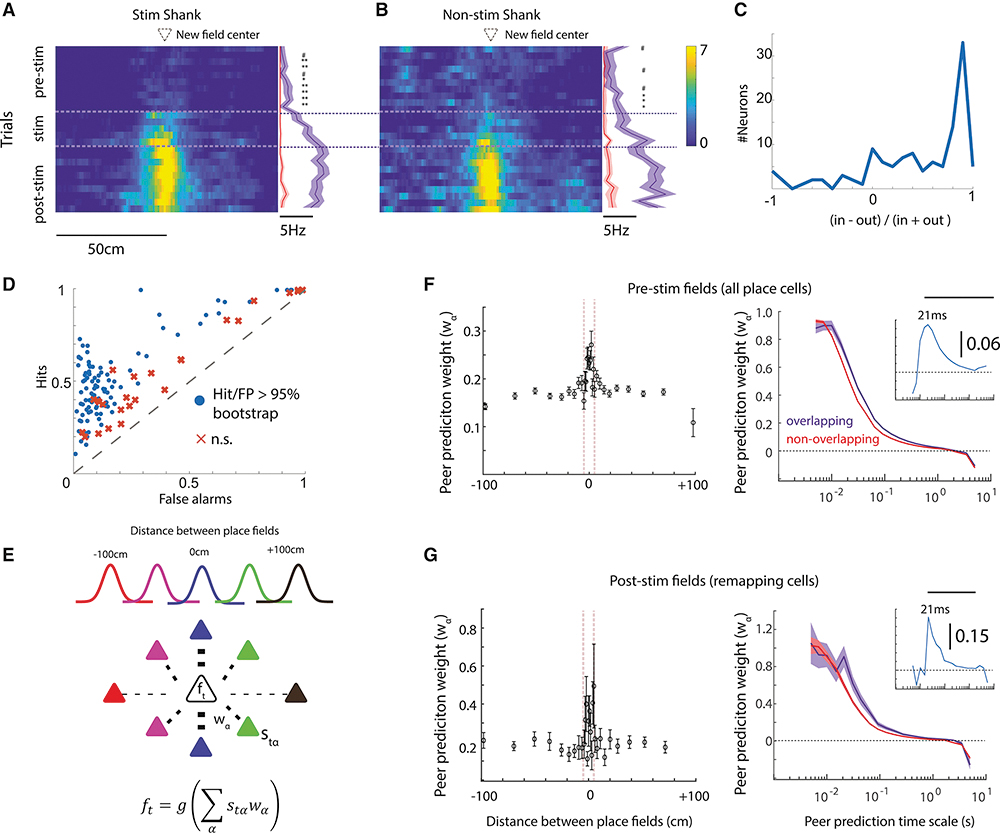
Figure 4). Relationship between pre-stimulation neural activity and post-stimulation remapping.
(A) For remapping neurons recorded on the stimulated shank, the median firing rate in the center of the induced place field (blue) was already higher prior to optogenetic stimulation than in other regions of the track (red). (B) Firing rate in the future place field prior to stimulation was also higher for neurons recorded on the non-stimulated shank. In-field vs out-of-field rate: # p< 0.1, * = p < 0.05, ** p < 0.01 (C) The distribution across remapping neurons of the difference-over-sum of the in-future-field firing rates versus the out-of-field firing rates measured prior to stimulation. In-future-field rates were defined as spikes measured when the mouse was ±5 cm around the future place field peak; out-field rates were the mean firing rates measured at all other locations on the track. (D) The classification performance of the RUSBoost algorithm across neurons (points = neuron) to predict whether the pattern of neural activity in a given place, on a given trial, was recorded in the location of the future place field, or within another location on the track. Neurons compared against classifier performance with place-shuffled data. (E) Method for relating pre-stimulation activity to subsequent place field distribution. Using data recorded during REST1, the binned firing rate of each target cell (ft) was predicted using the weighted (wα) binned rate (stα) of other simultaneously recorded pyramidal cells. These weights were then related to the distance between place fields of the target cell and each peer predictor. (F) Left, On average, for all pairs of neurons with overlapping pre-stimulation place fields (peaks within 5 cm) higher peer prediction weights were observed during REST1 as compared to pairs whose fields were further apart (spikes binned at 44-ms). Right, Higher peer prediction strengths for pyramidal pairs with overlapping place fields were observed across a range of binning time scales. Bar indicates p < 0.01 comparing peer prediction weights for pairs of neurons with overlapping versus non-overlapping place fields. Inset, difference between peer-prediction weights for neurons with overlapping versus non-overlapping place fields at each time bin. (G) Same as Panel D, though comparing post-stimulation place fields and limiting the analysis to just neuron pairs in which either the target or peer predictor remapped. Shaded error bars = S.E.M.

