FIG 2.
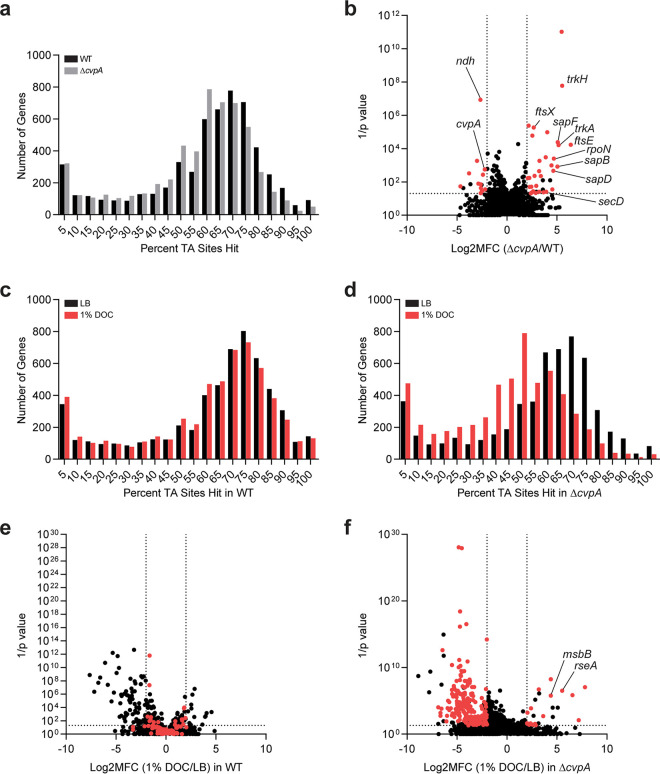
Transposon insertion sequencing screens reveal CvpA’s genetic interactions. (a) Distribution of the percentage of TA sites disrupted for all genes in the library constructed in the WT and ΔcvpA backgrounds. (b) Volcano plot depicting the relative abundance of read counts mapped to individual genes in transposon libraries in WT and ΔcvpA mutant backgrounds. The mean log2 fold change (Log2MFC) and Mann-Whitney U P value are shown for each gene. Genes highlighted in red have more than 5 unique transposon mutants, a log2FC of >2 or <−2, and a P value of <0.05. A modified ΔcvpA locus can sustain insertions at the 1 TA dinucleotide in the stop codon. (c and d) Distribution of the percentage of TA sites disrupted for all genes in the library constructed in the WT (c) or ΔcvpA background (d) after growth in LB or 1% DOC. (e and f) Volcano plot depicting the relative abundance of read counts mapped to individual genes in transposon libraries in WT (e) or ΔcvpA background (f) in LB versus in 1% DOC. The log2 mean fold change and Mann-Whitney U P value are shown for each gene. Genes highlighted in red are those for which the mean log2FC is >2 or <−2 and the P value is <0.05 in the ΔcvpA mutant background but not in the WT background.

